



Track Your Oxygen Levels: Free Pulse Oximeter Readings Chart PDF

Easily log your SpO₂ and heart rate with this editable and printable PDF.
Checking your oxygen saturation and heart rate regularly can provide valuable insight into your health—especially if you're managing a respiratory condition or just want to stay ahead of potential concerns.
To help you organize your results and notice trends over time, we’ve created a fillable PDF you can use daily to track your pulse oximeter readings.
What a Pulse Oximeter Measures
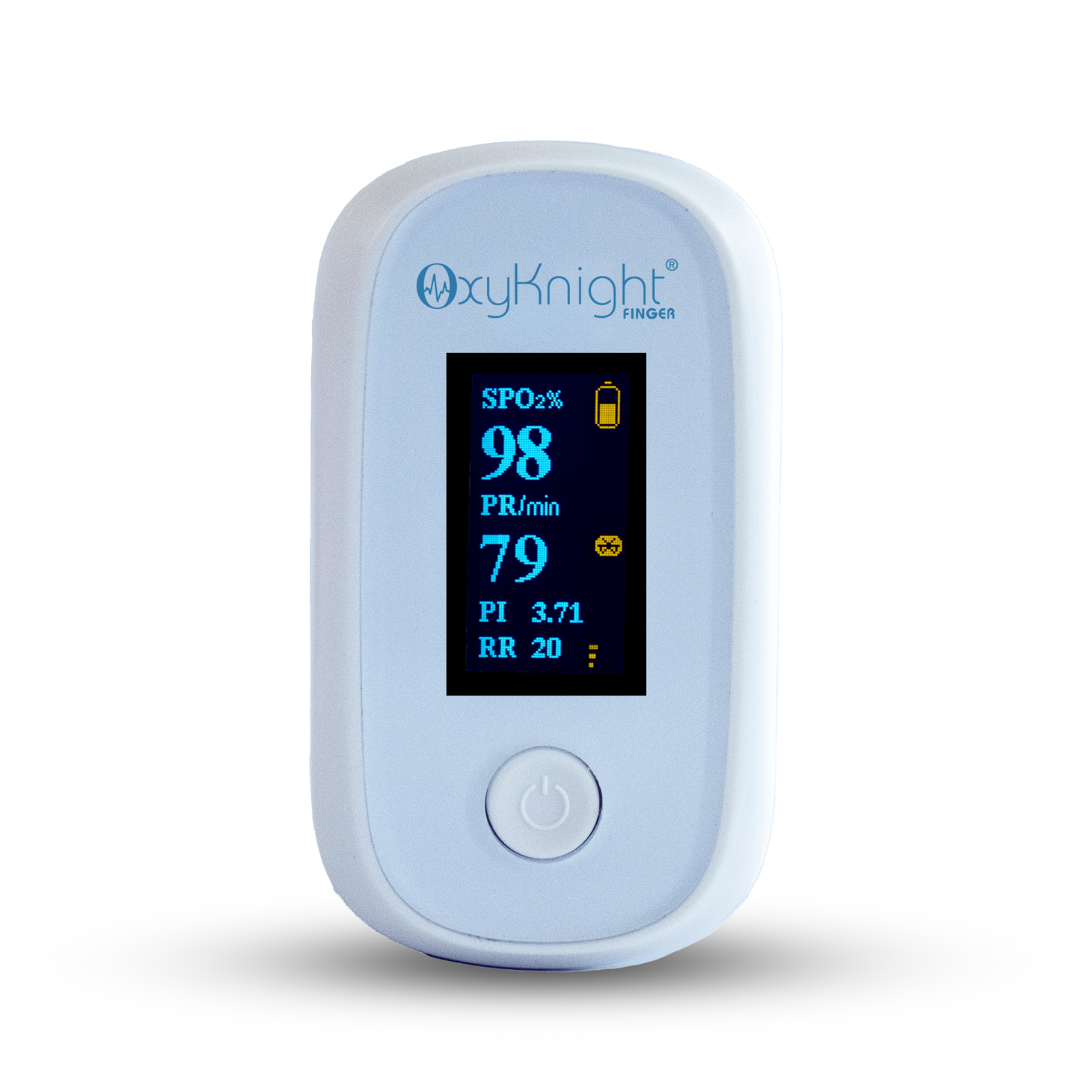
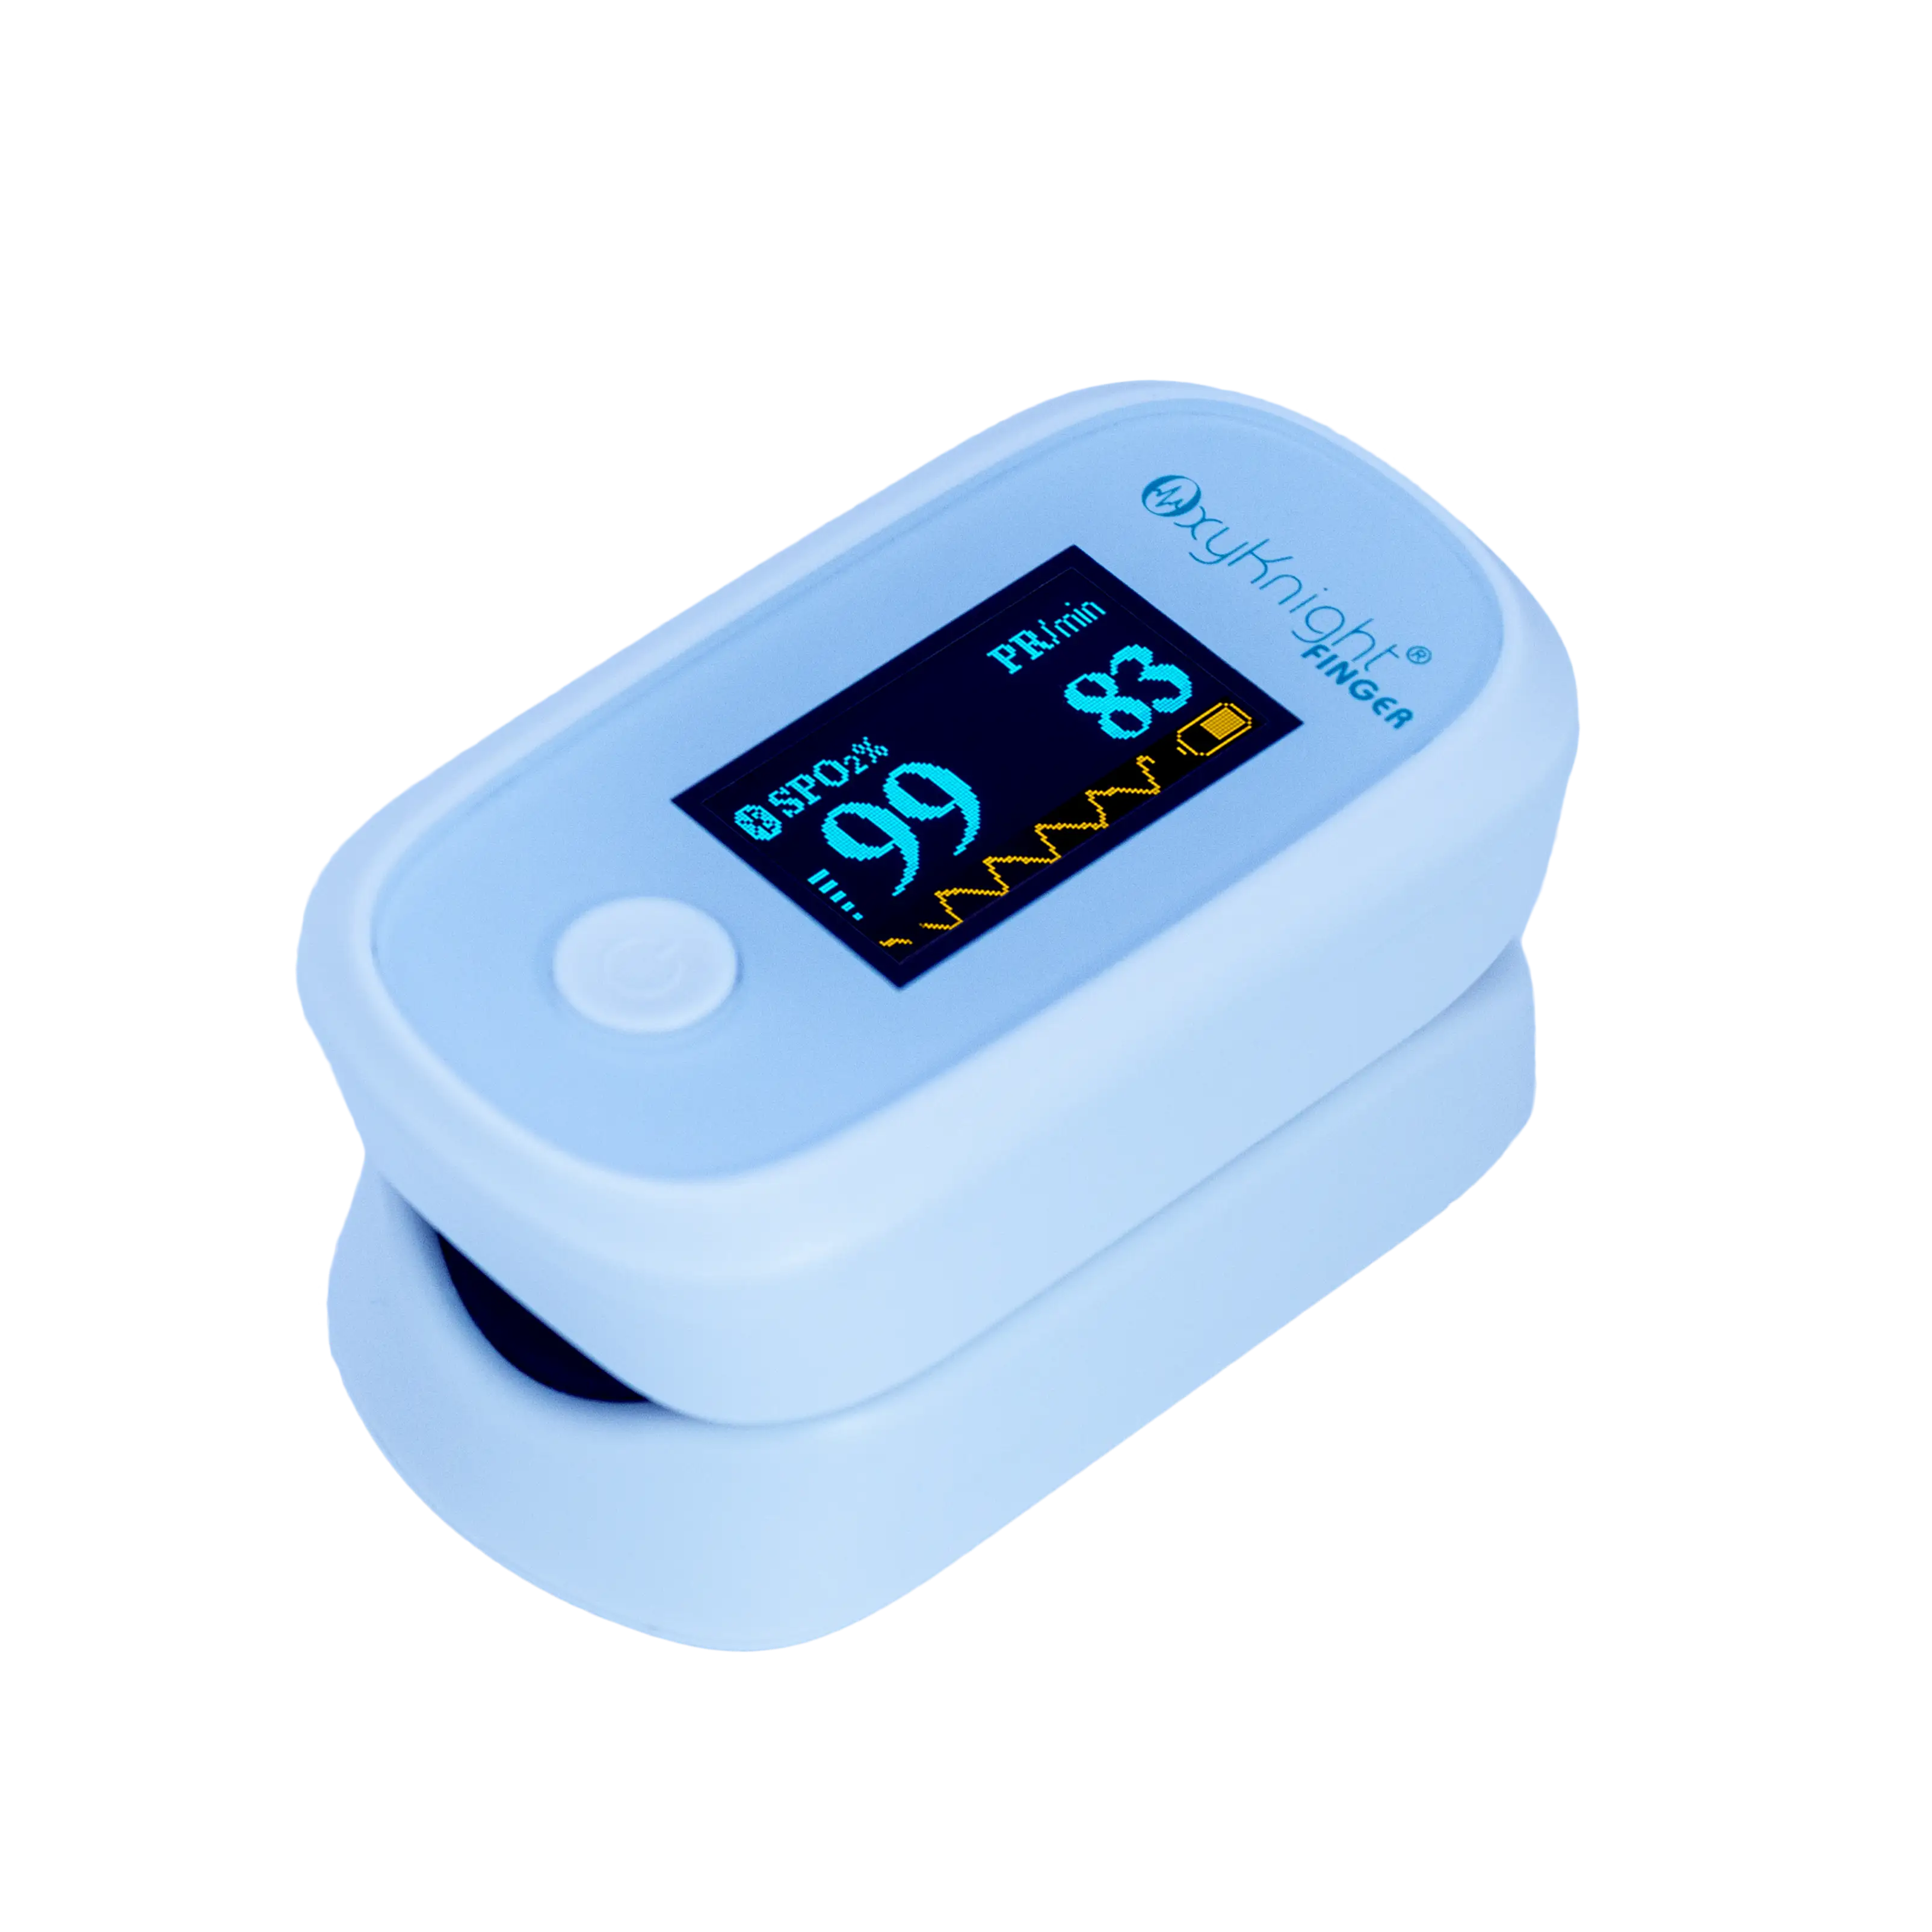
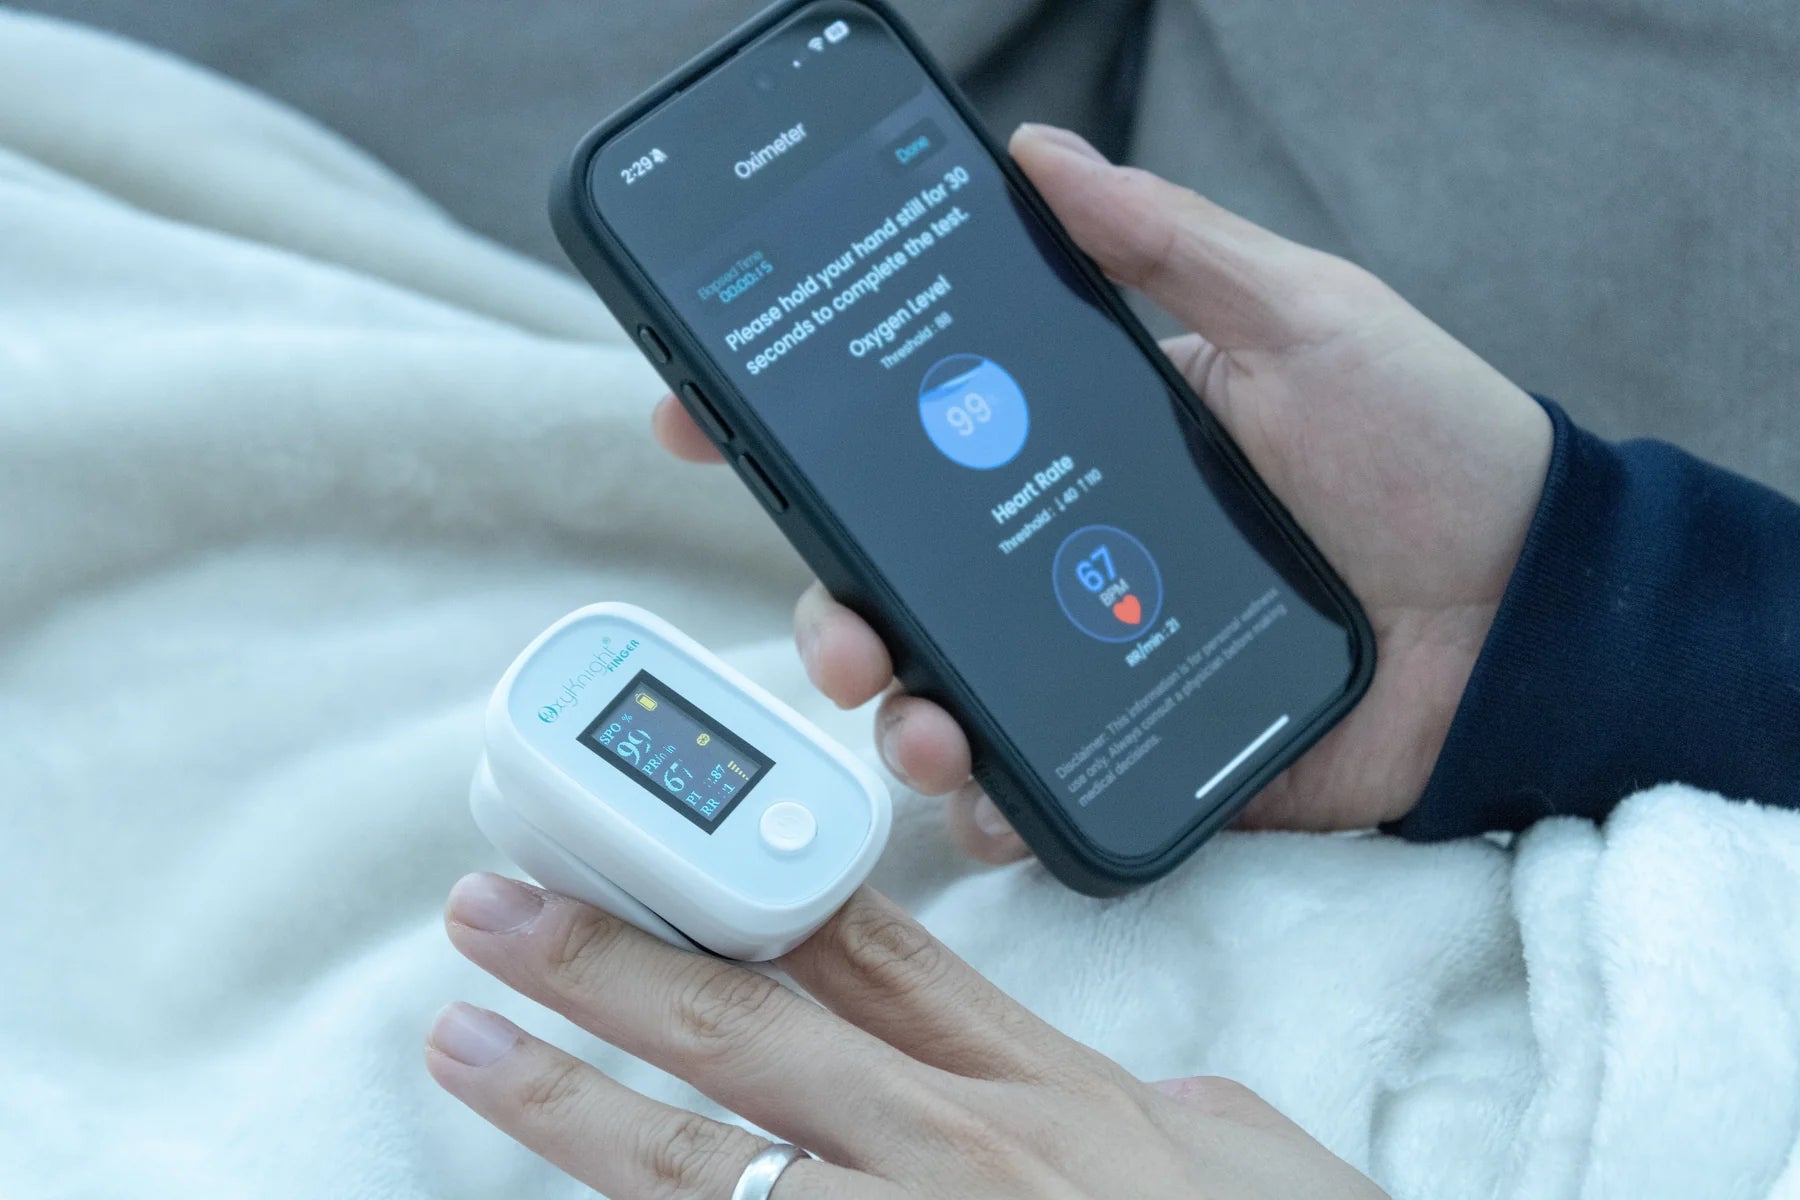
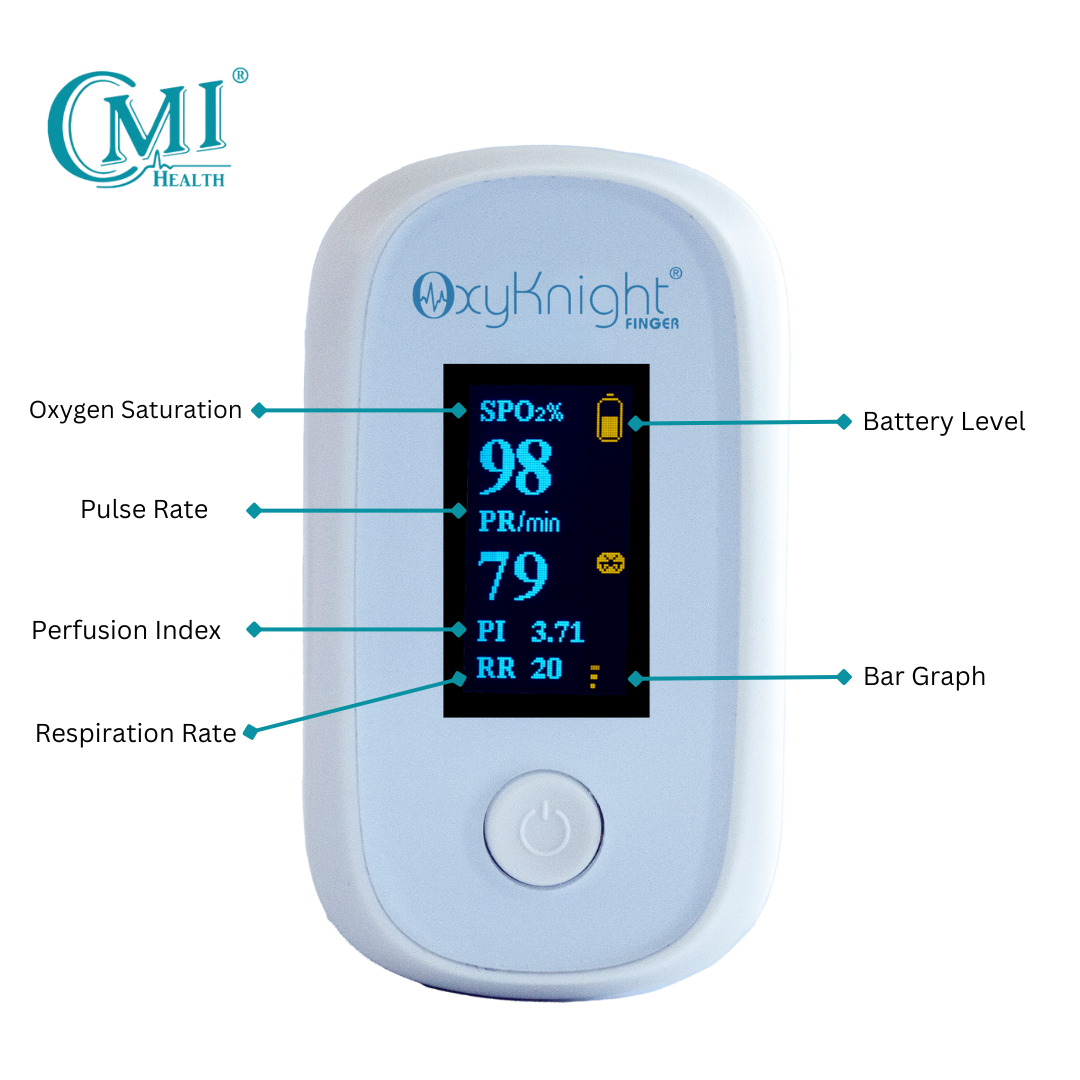
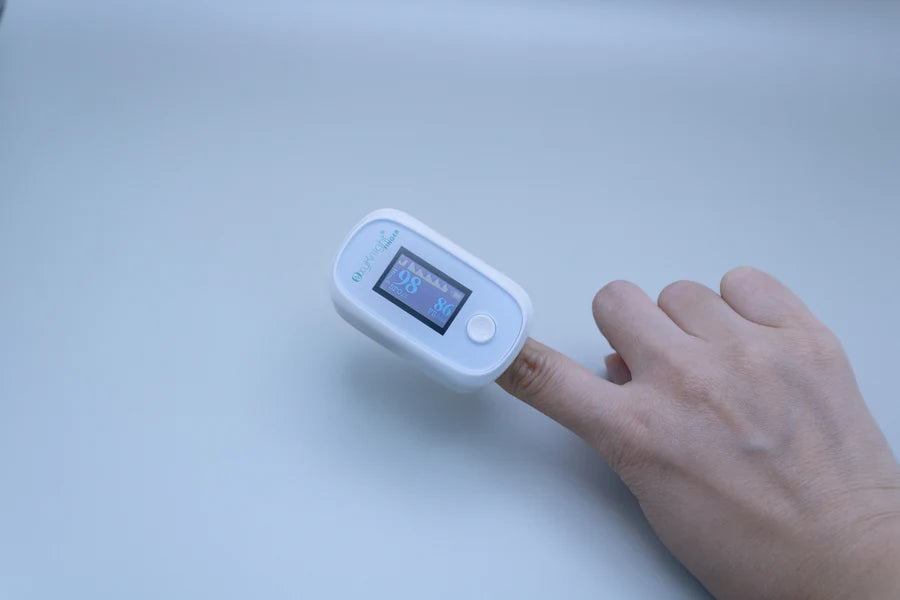
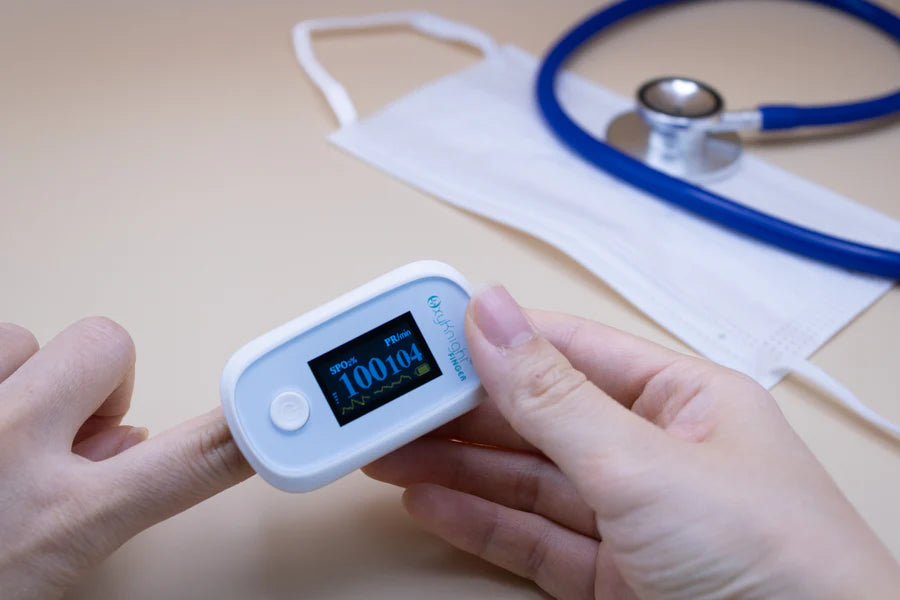
A pulse oximeter is a compact, non-invasive device that provides two key readings:
-
SpO₂ (Oxygen Saturation): The percentage of oxygen-carrying hemoglobin in your blood.
-
Pulse Rate (BPM): Your heart rate in beats per minute.
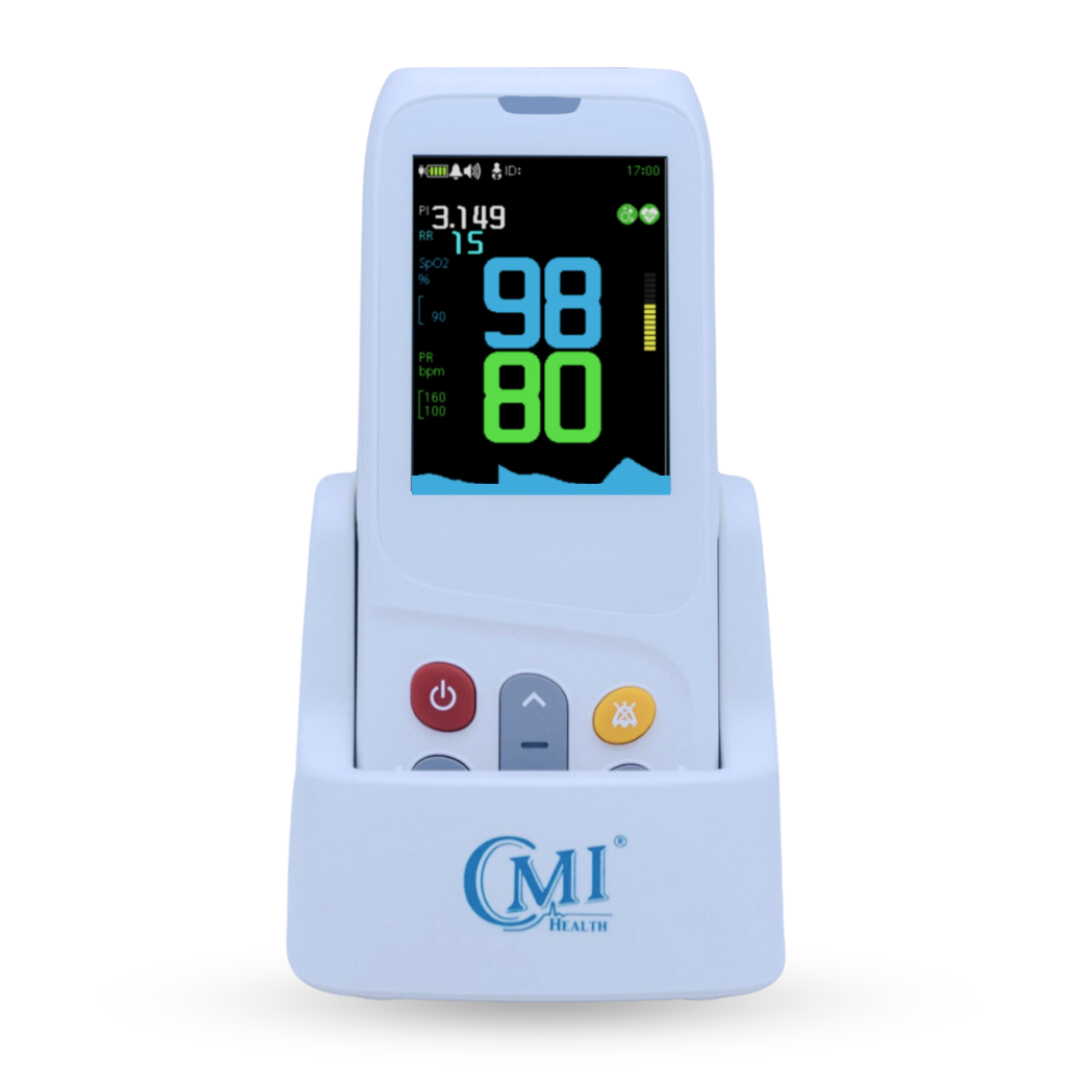
Ready to check your own readings? Browse CMI Health's pulse oximeter collection.

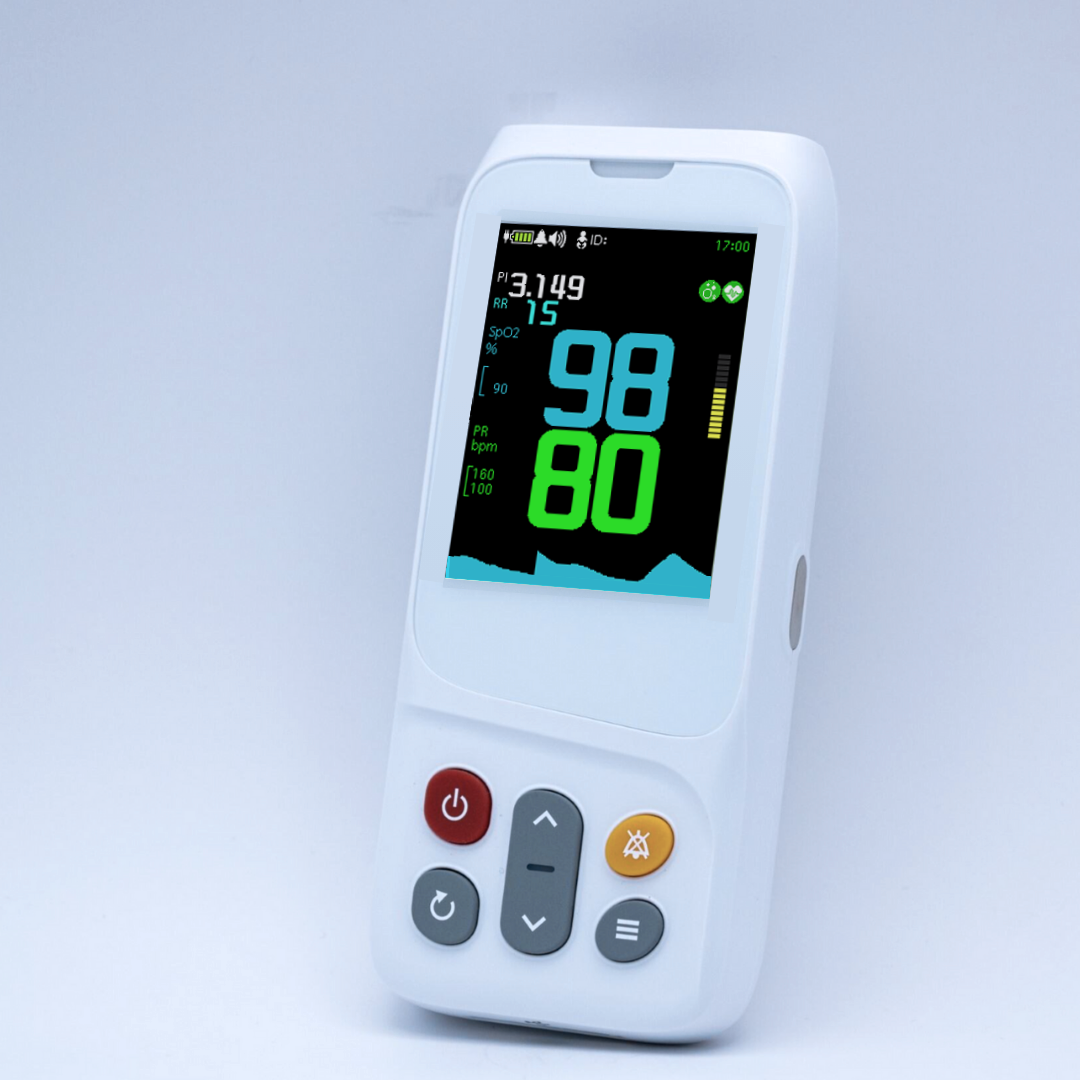
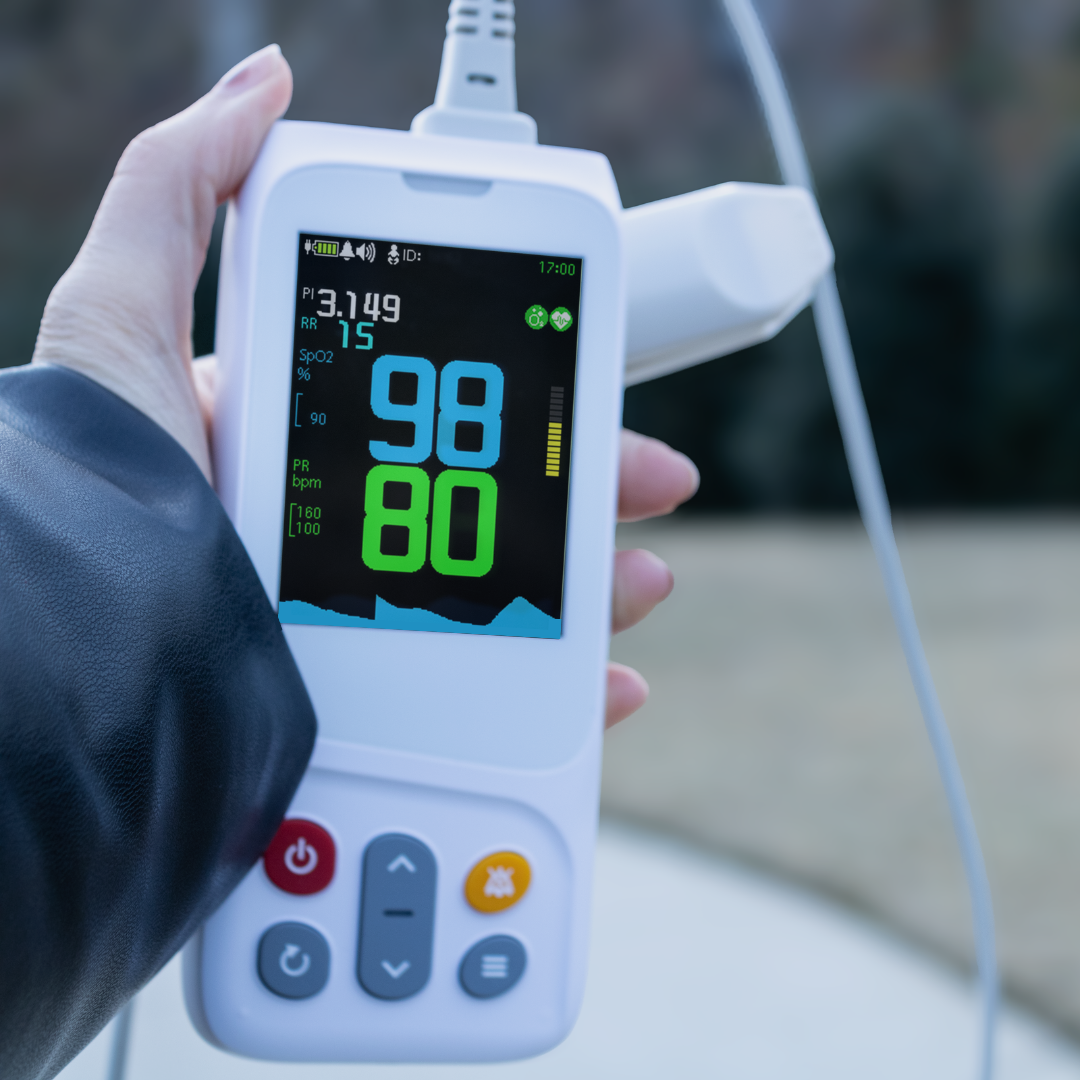
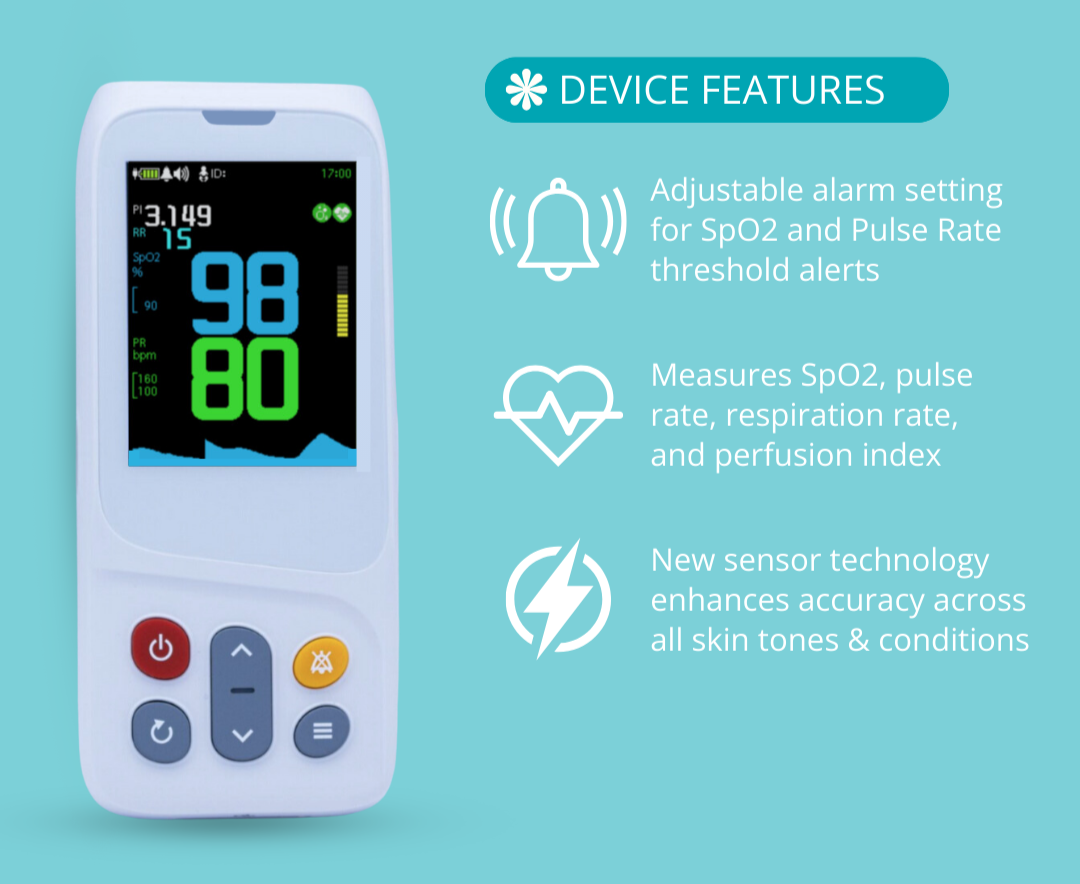
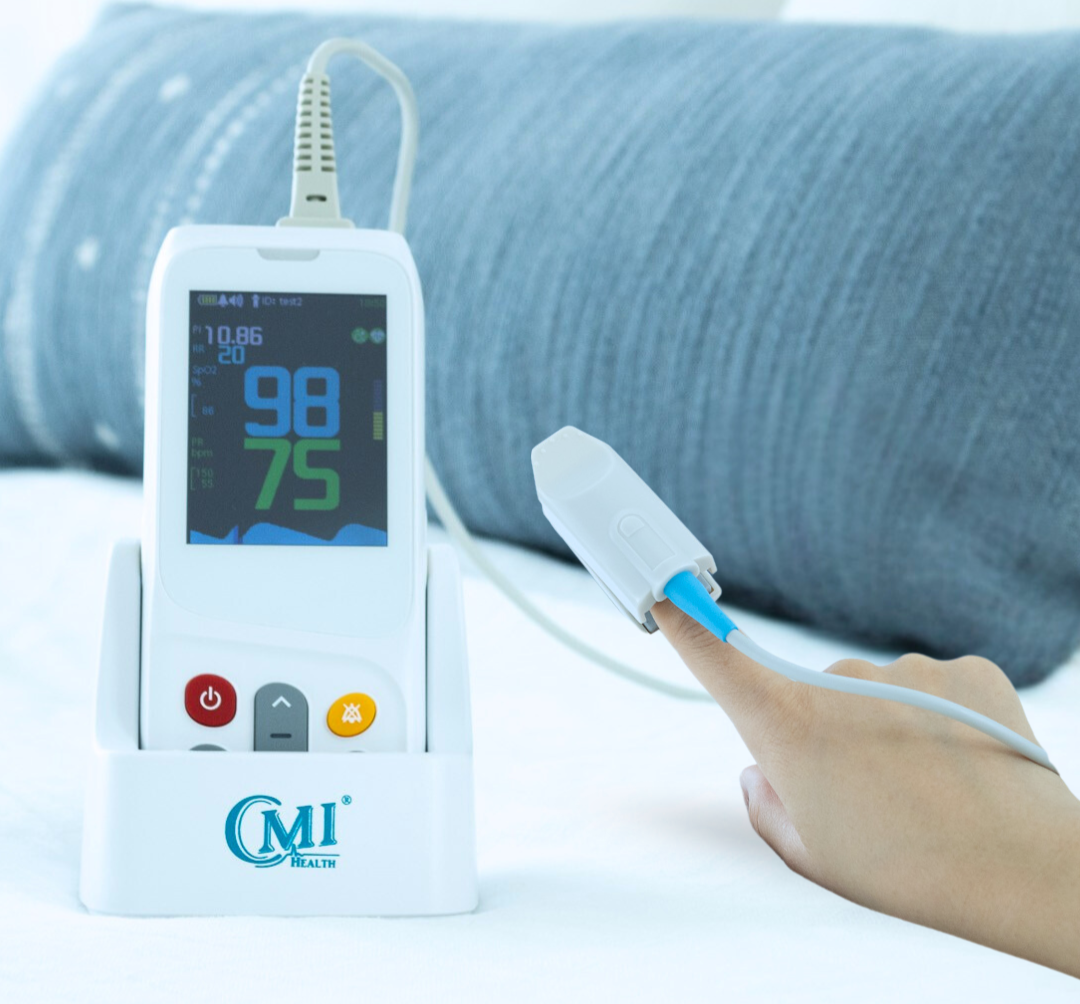
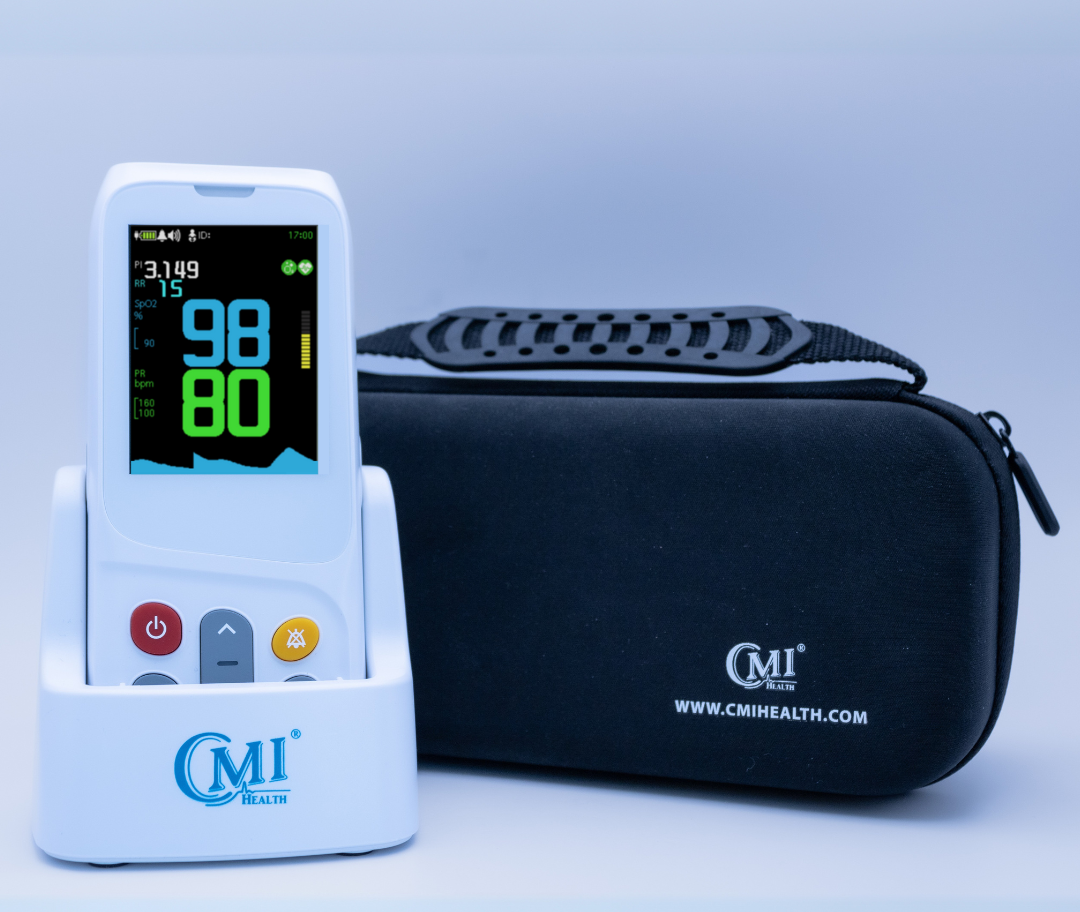
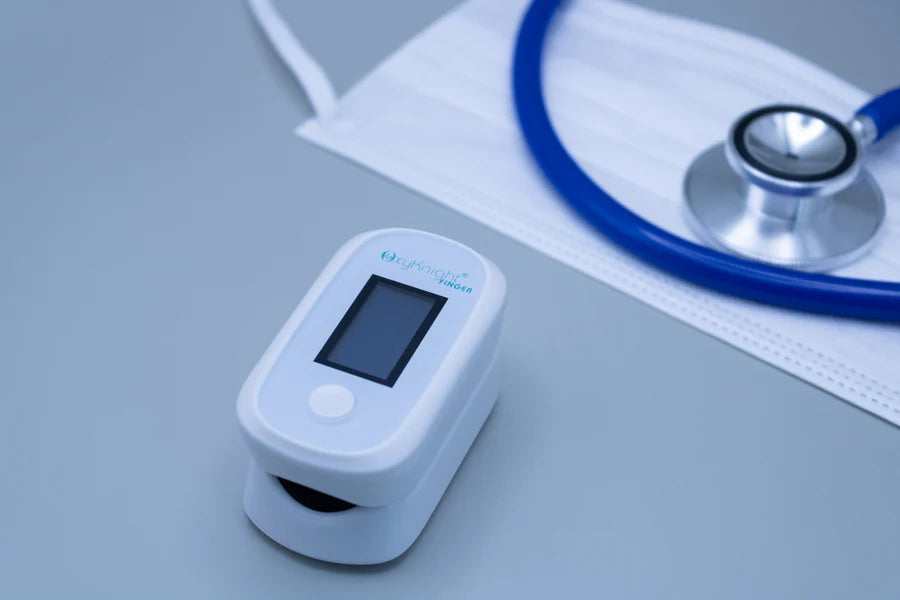
CMI Health’s Rechargeable Handheld Oximeter CH-100
These numbers can vary throughout the day, depending on activity, rest, or underlying health conditions. Tracking them over time helps you notice patterns—not just isolated numbers.
If you're unsure what each reading means, check out our guide:
Normal Readings on a Pulse Oximeter.
How to Determine Your Baseline Reading
Before you start tracking changes, it’s helpful to know your baseline—your typical oxygen level and pulse rate when you’re at rest and feeling well.
To find it:
-
Take readings at the same time each day, ideally when you're relaxed (e.g., just after waking or sitting calmly).
-
Record your results over three to five days.
-
Use the average of those readings as your baseline.
There’s space at the top of the downloadable chart to record this for future comparison.

Free Editable Pulse Oximeter Readings Chart (PDF)
This chart is designed to help you record your readings over time in a clear, structured way.

Download the editable PDF here.
What’s Included:
-
Personal information (Name, Date of Birth, Age, Baseline Reading)
-
A tracking table with space for:
-
Date and Time
-
Heart Rate (BPM)
-
Oxygen Level (%)
-
Temperature (°F)
-
Gauge (Better / Worse / Same)
-
Notes (e.g., symptoms, activity)

Understanding Your Readings at a Glance
Here’s a general reference for what your oxygen levels might indicate:

When to Consider Continuous Use
If you're managing a long-term condition, recovering from illness, or checking your oxygen levels during sleep or activity, continuous use of a pulse oximeter may be worth considering.
Unlike spot checks, continuous use:
-
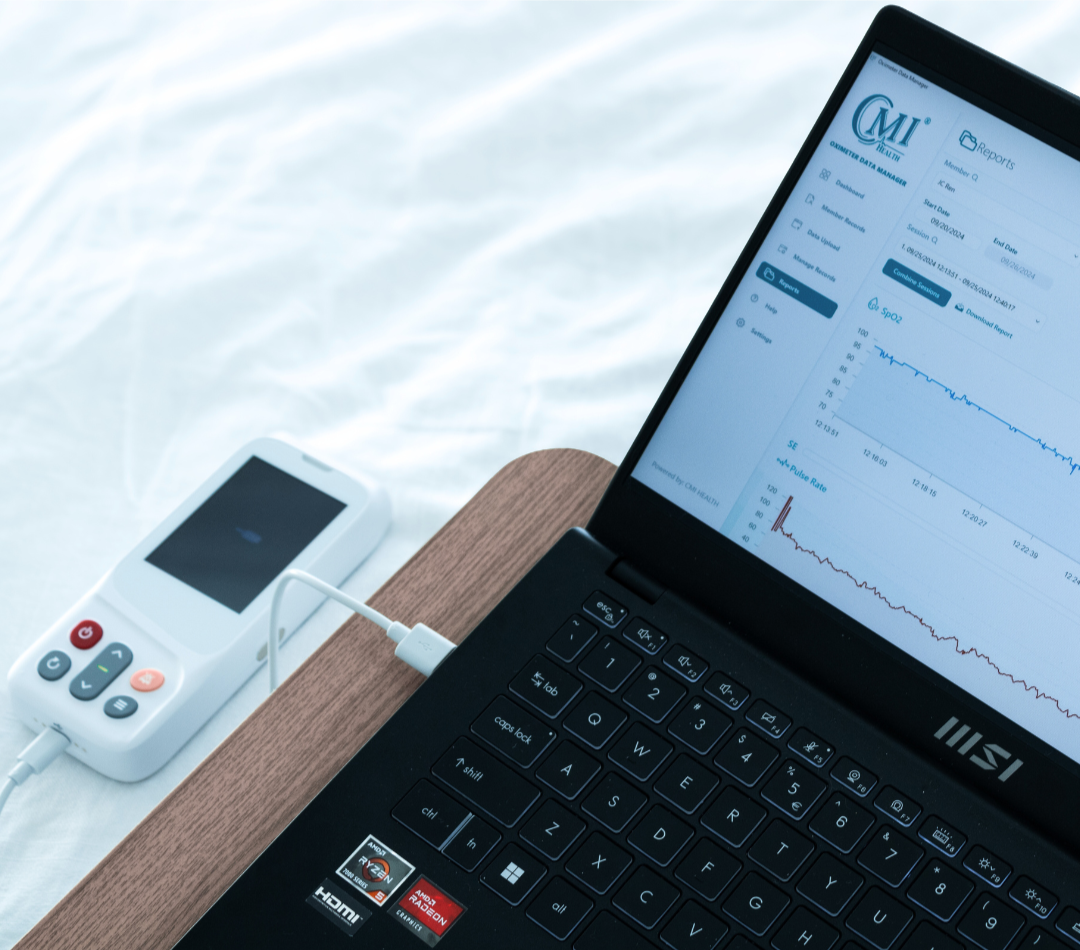
Automatically logs readings over time
-
Can detect overnight drops in oxygen saturation
-
Reduces the need for manual data entry
-
Helps highlight patterns and red flags more easily
Looking for a way to visualize sleep-related changes in oxygen and pulse? The AsthmaGo™ app may help.
Read our article about using AsthmaGo™ to track your sleep.
Explore CMI Health's Health Tracking Tools
Tracking your pulse oximeter readings doesn’t have to be complicated. With the right tools—and a bit of consistency—you can start noticing trends and having more informed conversations with your healthcare provider.
CMI Health offers a range of easy-to-use devices and digital tools to help you take control of your respiratory health.
Download the editable Pulse Oximeter Readings Chart (PDF)
Then explore our entire collection of health tracking devices here to find the tools that work for your needs.
Frequently Asked Questions
What does a pulse oximeter measure?
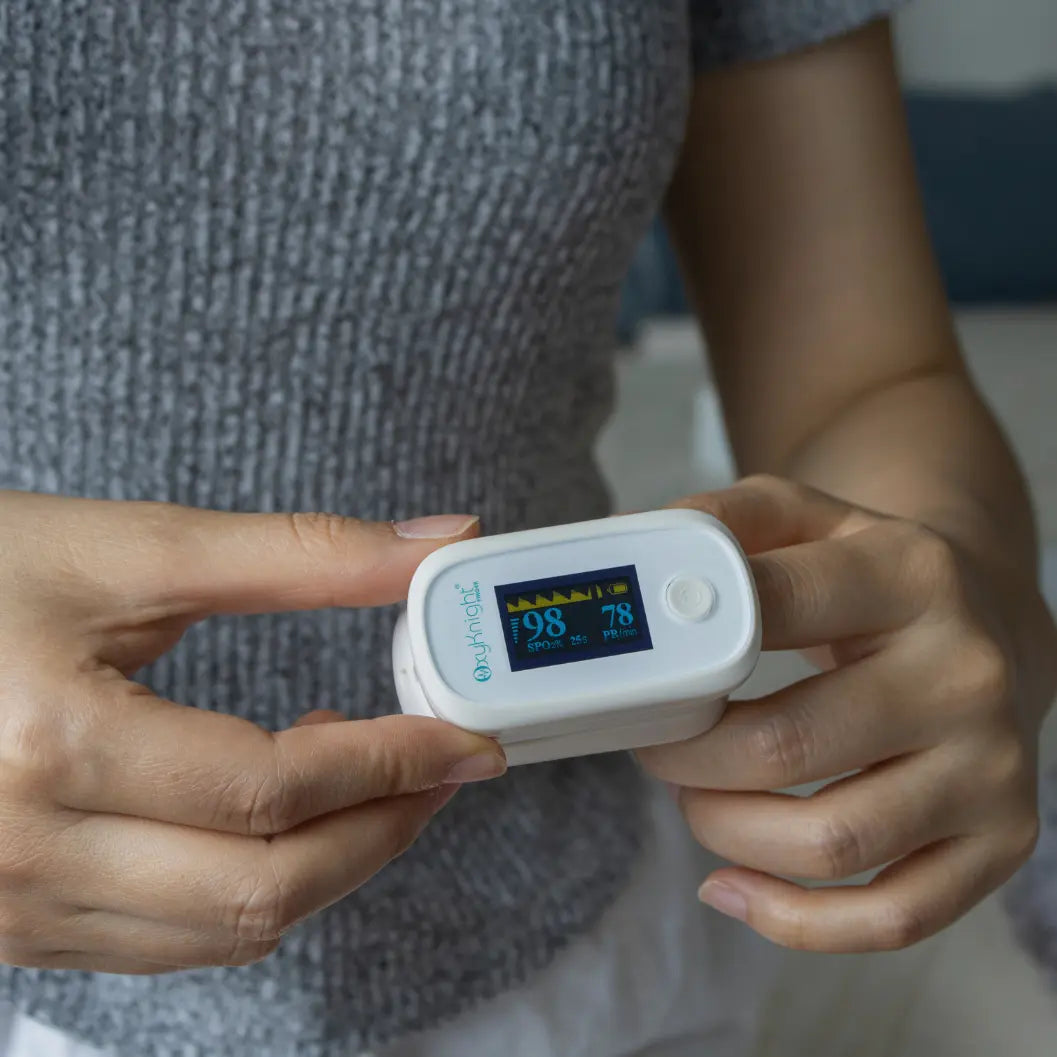
A pulse oximeter measures two things: your SpO₂ (blood oxygen saturation) and your pulse rate in beats per minute. It's a small, non-invasive device that clips onto your finger.
What is considered a normal SpO₂ reading?
Generally, 95–100% is considered a normal range. Readings of 91–94% are considered mildly low, 86–90% moderate, and 85% or below is considered severe. These ranges are general guidelines and not a diagnosis. Always check with your healthcare provider about what's normal for you.
How do I find my baseline oxygen level?
Take readings at the same time each day while you're relaxed, such as right after waking up. Record your results over three to five days, then average them to find your baseline. You can note this baseline at the top of the tracking chart for future reference.
Can I fill out the tracking chart on my phone or computer?
Yes. The PDF chart is editable, so you can fill it out directly on a computer or mobile device, or print it out and complete it by hand.
What information does the tracking chart include?
The chart includes space for patient information (name, date of birth, age, baseline reading) along with a tracking table for date and time, heart rate, oxygen level, temperature, a status indicator (better/worse/same), and notes for symptoms or activity.
When should I consider continuous monitoring instead of spot checks?
Continuous monitoring may be worth considering if you're managing a long-term condition, recovering from illness, or want to track oxygen levels during sleep or activity. Unlike spot checks, it automatically logs readings over time, can catch overnight drops in oxygen, and reduces manual data entry.



Leave a comment