



FEV1, FVC & FEV1/FVC Ratio: How to Read Your Spirometry Results

Written by Dallas Akins
Quick Answer: What Are Normal FEV1, FVC & FEV1/FVC Values?
FEV1 measures how much air you can forcefully exhale in the first second, while FVC measures the total amount you can forcefully exhale. An FEV1 or FVC of 80% or more of predicted has traditionally been used as a general reference point, while around 70% or higher is a commonly cited adult reference point for the FEV1/FVC ratio.
These are useful starting points rather than universal cutoffs. Expected spirometry values vary from person to person, so your individual reference range provides important context.

If you have spirometry results in front of you, you may be wondering what all those numbers mean and whether yours fall within a normal range. Fortunately, once you understand a few key measurements, the results become much easier to follow.
Let's break down FEV1, FVC, and the FEV1/FVC ratio and look at how reference values help put your results into context.
What Does “Percent Predicted” Mean?
There isn't one FEV1 or FVC measurement in liters that's normal for everyone. Instead, spirometry software uses a reference equation that accounts for factors such as your age, height, and sex to estimate a predicted value for you.
Percent predicted simply compares your measured result with that predicted value.
Measured value ÷ Predicted value × 100 = % predicted
For example:
Predicted FEV1: 3.5 L
Measured FEV1: 3.0 L
3.0 ÷ 3.5 × 100 = about 86% predicted
This doesn't mean your lungs are “86% healthy.” It means your measured FEV1 was about 86% of your predicted value.
Traditionally, FEV1 and FVC values of 80% or more of predicted have been used as general reference points. However, 80% isn't a universal cutoff, so your individual expected range also matters.

What Is FEV1 & What Is a Normal FEV1 Range?
FEV1 stands for Forced Expiratory Volume in one second. It measures how much air you can forcefully breathe out during the first second of an exhalation.
An easy way to remember it is:
FEV1 = First second
If you're looking for an FEV1 normal range, 80% or more of predicted is a commonly cited general reference point.
A result below 80% predicted does not automatically mean it falls outside your expected range. Your predicted value and individual reference information help put the measurement into context.
What Is FVC & What Is a Normal FVC Range?
FVC stands for Forced Vital Capacity. It measures the total amount of air you can forcefully breathe out after taking a full breath in.
The difference is simple:
FEV1 = How much air came out during the first second?
FVC = How much air came out in total?
If you exhale 3 liters during the first second and 4 liters in total, for example:
FEV1 = 3 L
FVC = 4 L
Like FEV1, 80% or more of predicted FVC is a commonly cited general reference point. But there isn't one FVC normal range in liters that applies to everyone. Your result needs to be considered in relation to your predicted and reference values.

What Is the FEV1/FVC Ratio & What Is Normal?
The FEV1/FVC ratio compares how much air you exhale during the first second with the total amount you forcefully exhale.
Using our example:
FEV1 = 3 L
FVC = 4 L
3 ÷ 4 = 0.75, or 75%
That means 75% of the total forced volume was exhaled during the first second.
A ratio of approximately 0.70, or 70%, is a commonly cited adult reference point. However, expected FEV1/FVC changes with age, so 70% isn't a universal cutoff. Your individual reference range provides more context for understanding your result.
Spirometry Normal Values Chart
Here’s a quick spirometry normal values chart for the main measurements:

What Is LLN & Why Does It Matter?
If 80% and 70% aren't universal cutoffs, how is your expected range determined?
One term you may see on a spirometry report is LLN, or Lower Limit of Normal.
The simplest way to understand it is:
LLN is the bottom of your expected range.
Your predicted value represents the average result expected for someone with your characteristics. The LLN marks the lower boundary of that expected range.
So instead of asking only:
“Is my FEV1 at least 80% of predicted?”
a more individualized question is:
“Does my FEV1 fall within the expected range for someone like me?”
A result below the LLN falls below that reference boundary and can be considered alongside your other spirometry measurements.
You may also see a z-score on your report. This number helps show where your result falls within the expected range for someone with your characteristics.
How to Read Your Spirometry Results
If you have your results in front of you, work through the main numbers in four steps:
1. Find Your FEV1 and FVC
Identify the measured values, then look for their predicted values or percentages of predicted.
2. Find Your FEV1/FVC Ratio
This tells you what percentage of your total forced exhalation occurred during the first second.
3. Check Your Reference Information
Look for your percent predicted, reference range, or LLN rather than comparing only the raw number in liters.
4. Consider the Numbers Together
FEV1, FVC, and FEV1/FVC aren’t interpreted as completely separate measurements. The relationship between them helps show the overall spirometry pattern.
What Can Different Spirometry Patterns Look Like?
You may encounter terms such as obstructive, restrictive, or mixed when spirometry results are reviewed.
These describe patterns in results rather than diagnoses.

For example, a lower FVC can be part of a pattern that prompts further evaluation, but spirometry alone generally cannot confirm why FVC is low.
The important takeaway is that the relationship between the measurements matters. These patterns should be interpreted with your doctor rather than used for self-diagnosis.
Can You Track FEV1 at Home?
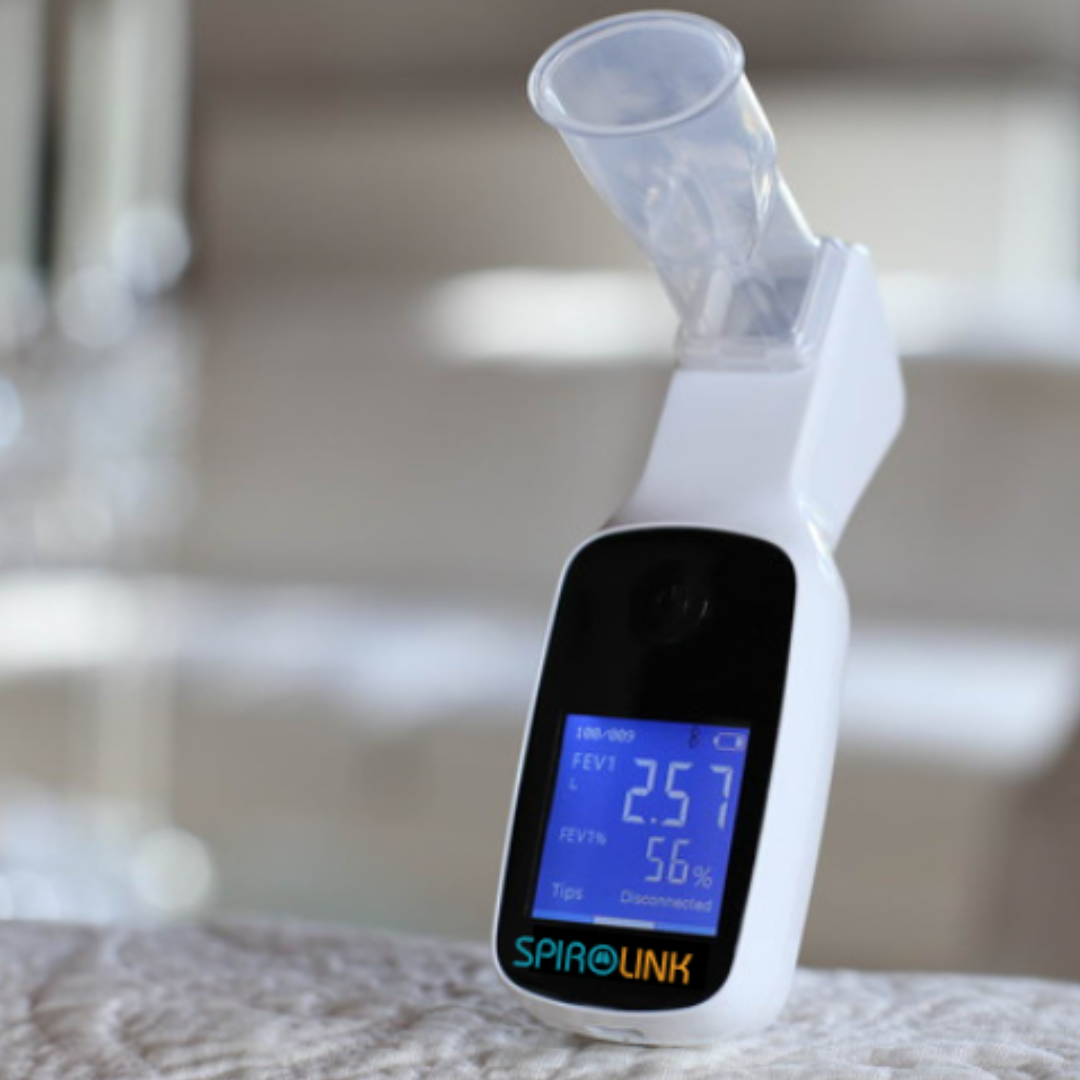
A digital spirometer can make it easier to take airflow readings at home and save results so you can see how your measurements change over time.

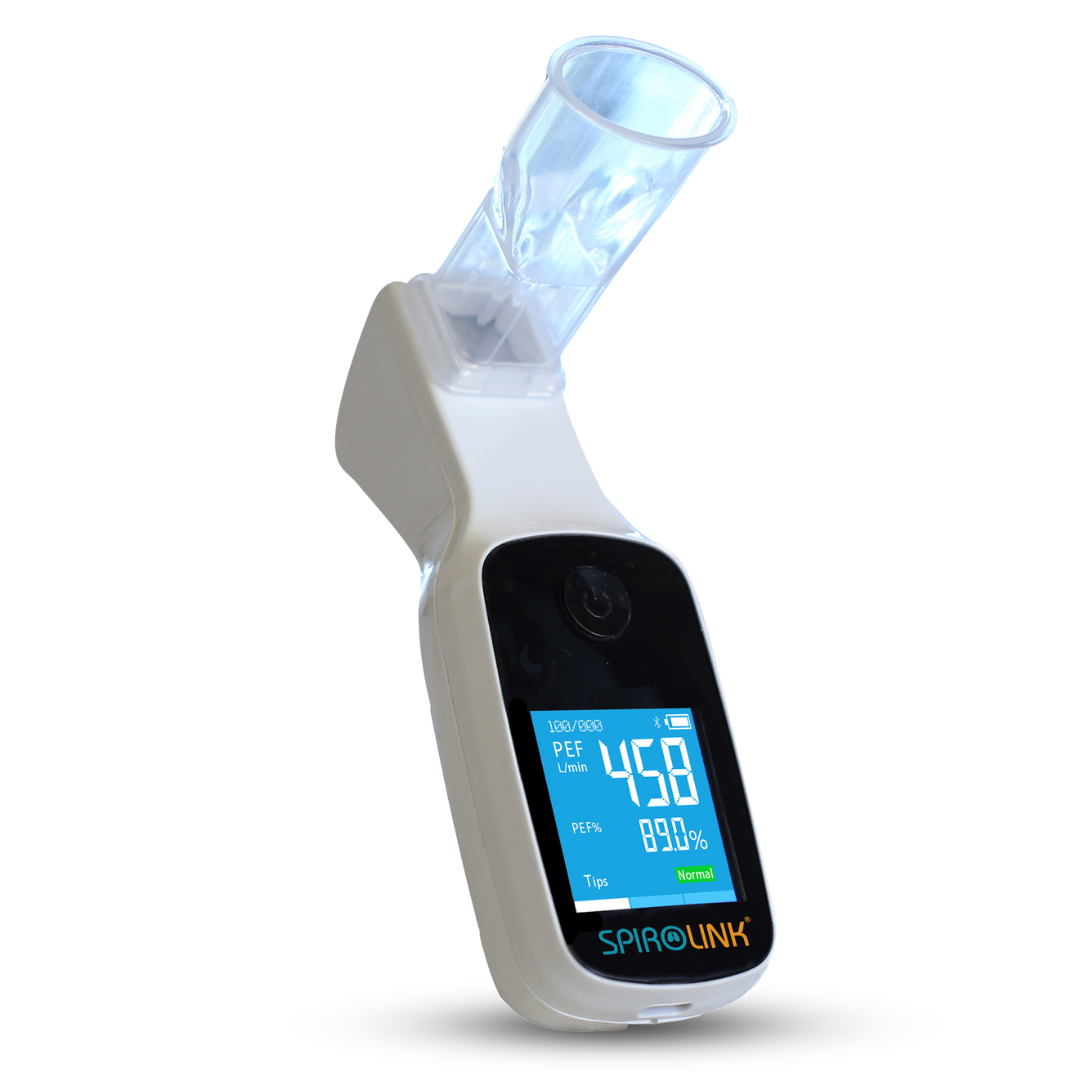
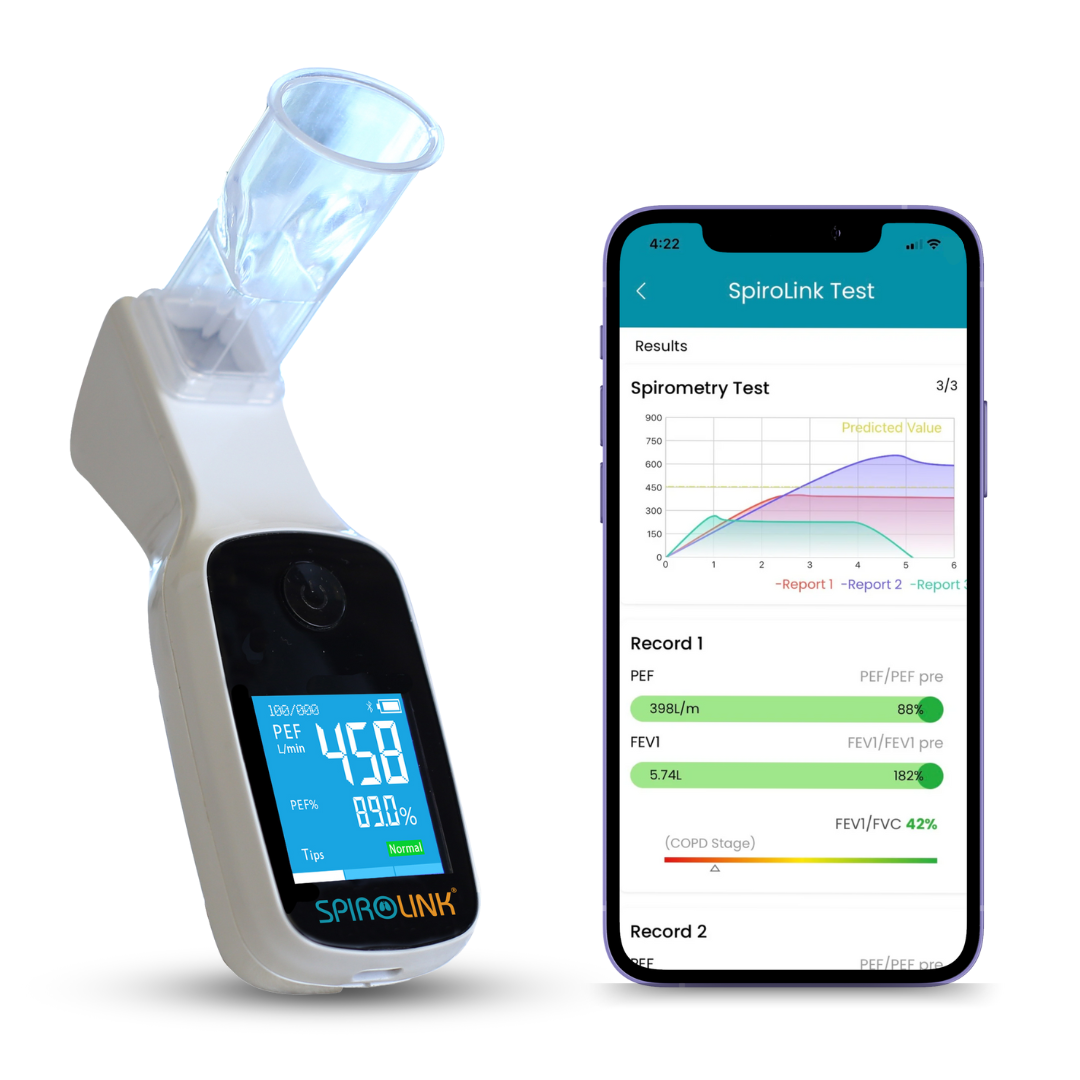
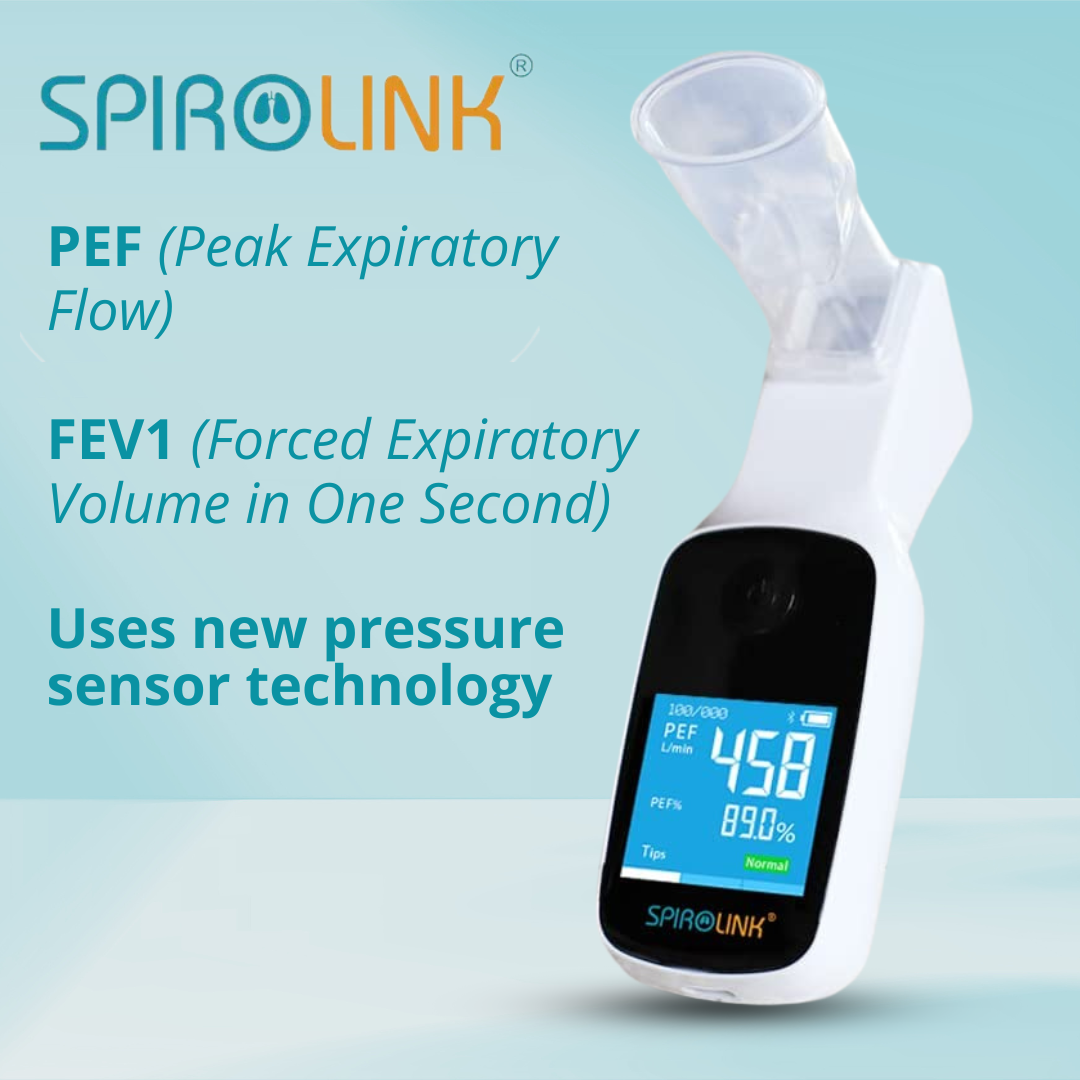
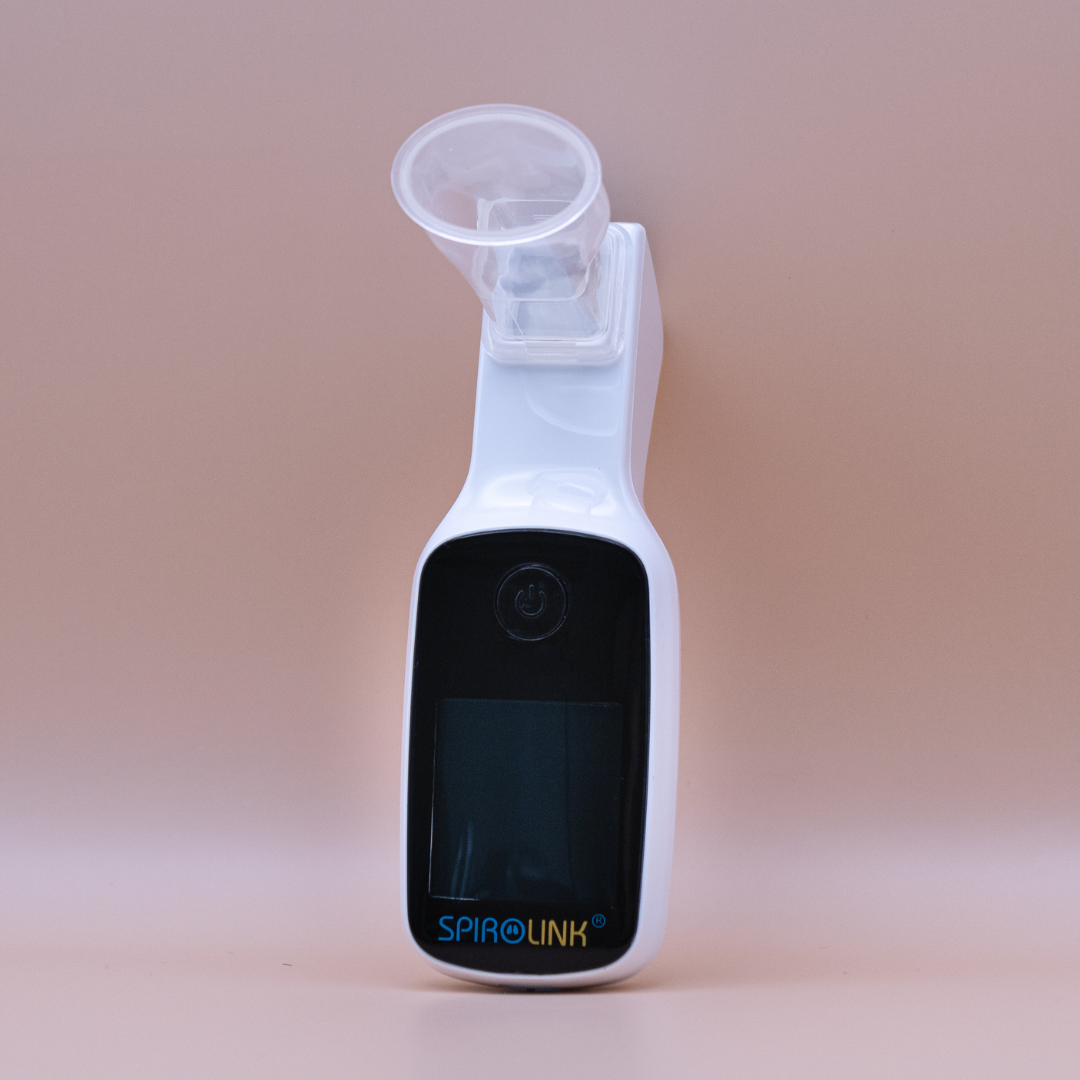
The SpiroLink® Smart Spirometer from CMI Health measures FEV1, FVC, and PEF. The SpiroLink® app also allows you to save your results so you can review your airflow data over time.
This makes it possible to track your FEV1 and FVC at home with a digital spirometer and keep a history of your readings to discuss with your doctor.
Explore CMI Health's spirometer collection to learn more about personal airflow tracking options.
Understanding Your Spirometry Results
You don't need to memorize every term on a spirometry report. Start with three measurements:
FEV1 = air exhaled in the first second
FVC = total forced breath out
FEV1/FVC = the relationship between the two
The commonly cited 80% predicted reference point for FEV1 and FVC and approximately 70% reference point for the FEV1/FVC ratio can help you understand your numbers, while your individual expected range provides additional context, and if you see LLN, it simply means the bottom of that expected range.
If you'd like to learn more about the test itself, including what spirometry measures and how it's performed, read our CMI Health guide, “What Is Spirometry? What to Expect from a Spirometry Test.”
If your results fall outside the reference range provided with your test or you aren't sure what your numbers mean, talk with your doctor about how they should be interpreted for you.
Frequently Asked Questions
What is a normal FEV1?
FEV1 of 80% or more of predicted has traditionally been used as a general reference point. However, 80% isn't a universal cutoff. Your predicted value and individual expected range provide more context for understanding your result.
What is a normal FVC?
FVC of 80% or more of predicted is another commonly cited general reference point. There isn't one normal FVC in liters for everyone, so your predicted and reference values provide important context.
What does LLN mean in spirometry?
LLN stands for Lower Limit of Normal. In simple terms, it's the lower boundary of your expected range. A result below the LLN falls below that reference boundary and should be considered alongside your other spirometry measurements.





Leave a comment