How to Read a Vital Signs Monitor

A clinician’s guide to interpreting blood pressure, SpO₂, pulse rate, temperature, and ECG readings on the PC-303 Vital Signs Monitor.
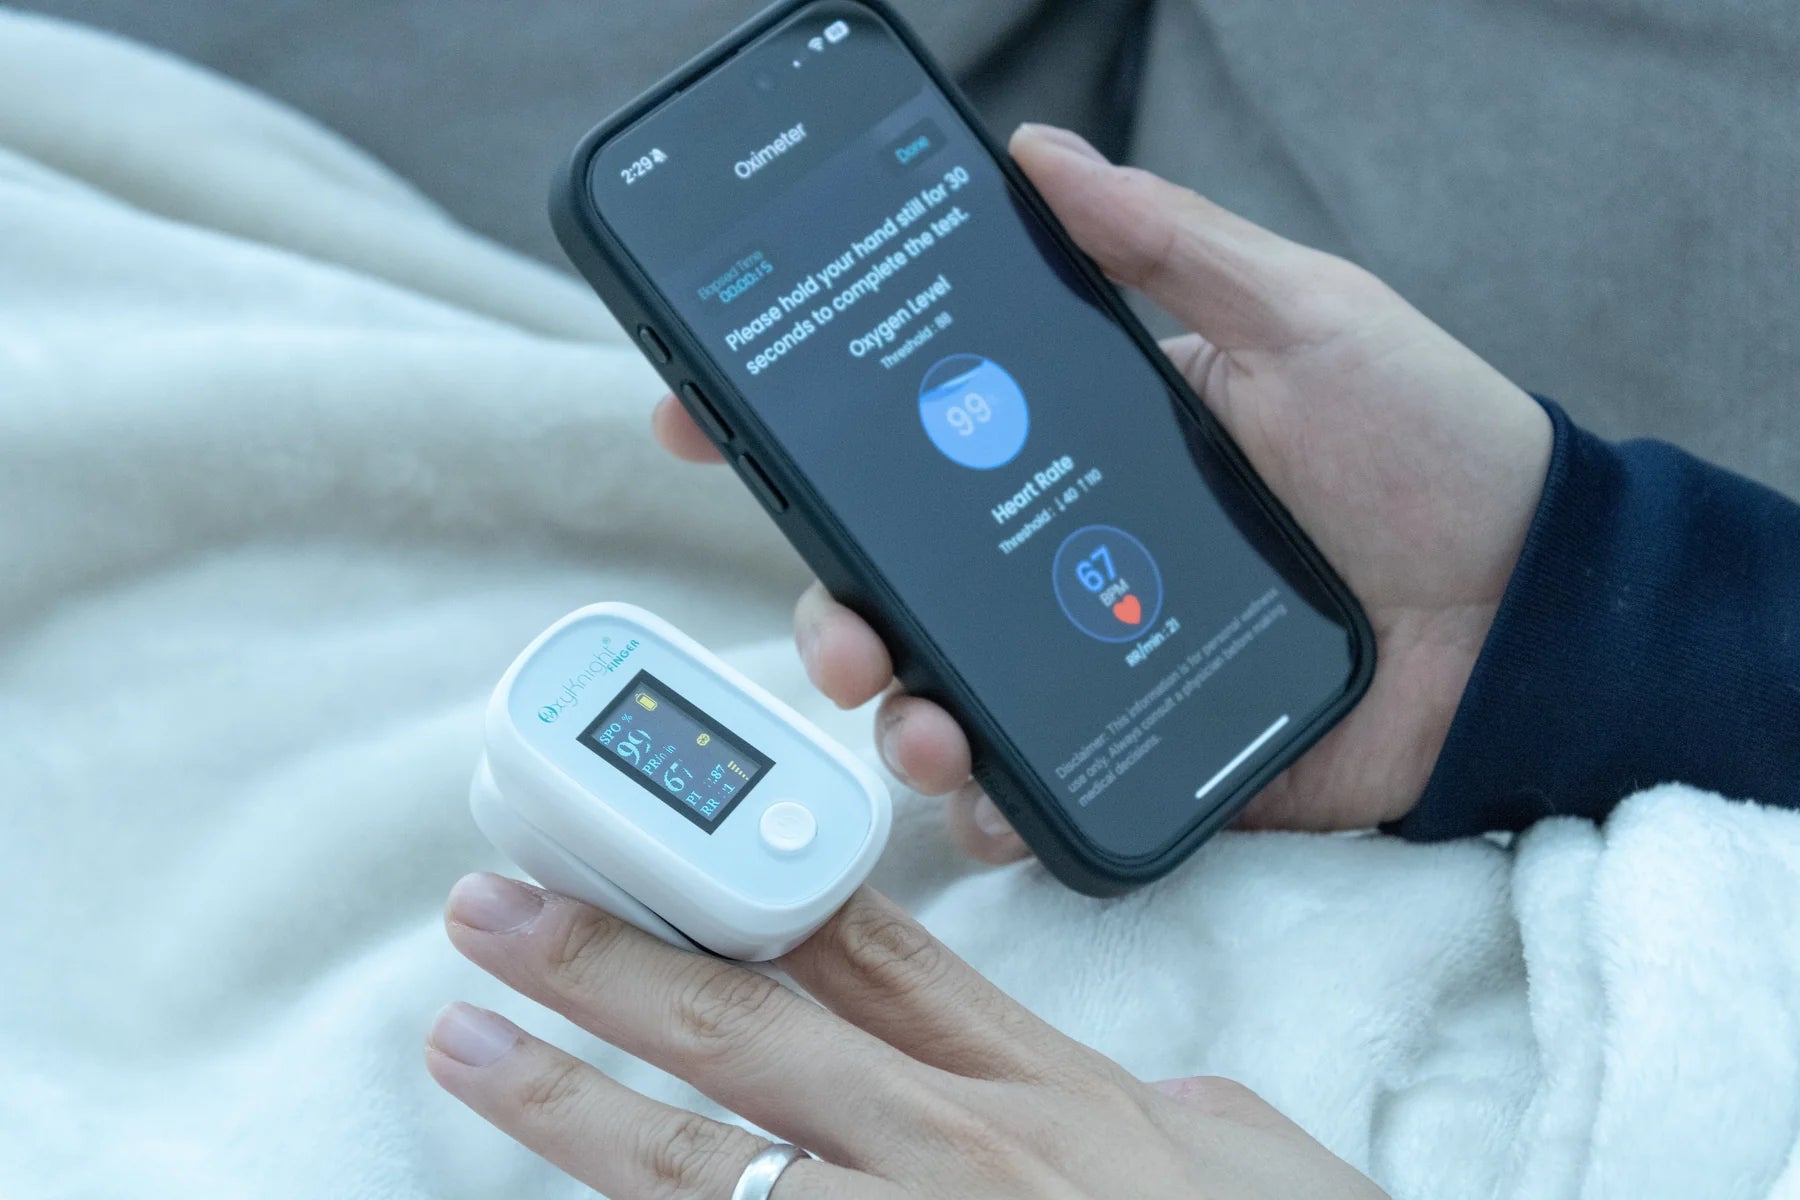
Vital signs monitors display key physiological measurements such as blood pressure, oxygen saturation (SpO₂), pulse rate, and temperature. Interpreting these values quickly is an important part of routine patient assessment.
In this guide, we’ll look at the PC-303 Vital Signs Monitor display, explain how the information is organized on the screen, and walk through what each number and abbreviation represents.
What Does the PC-303 Vital Signs Monitor Measure?
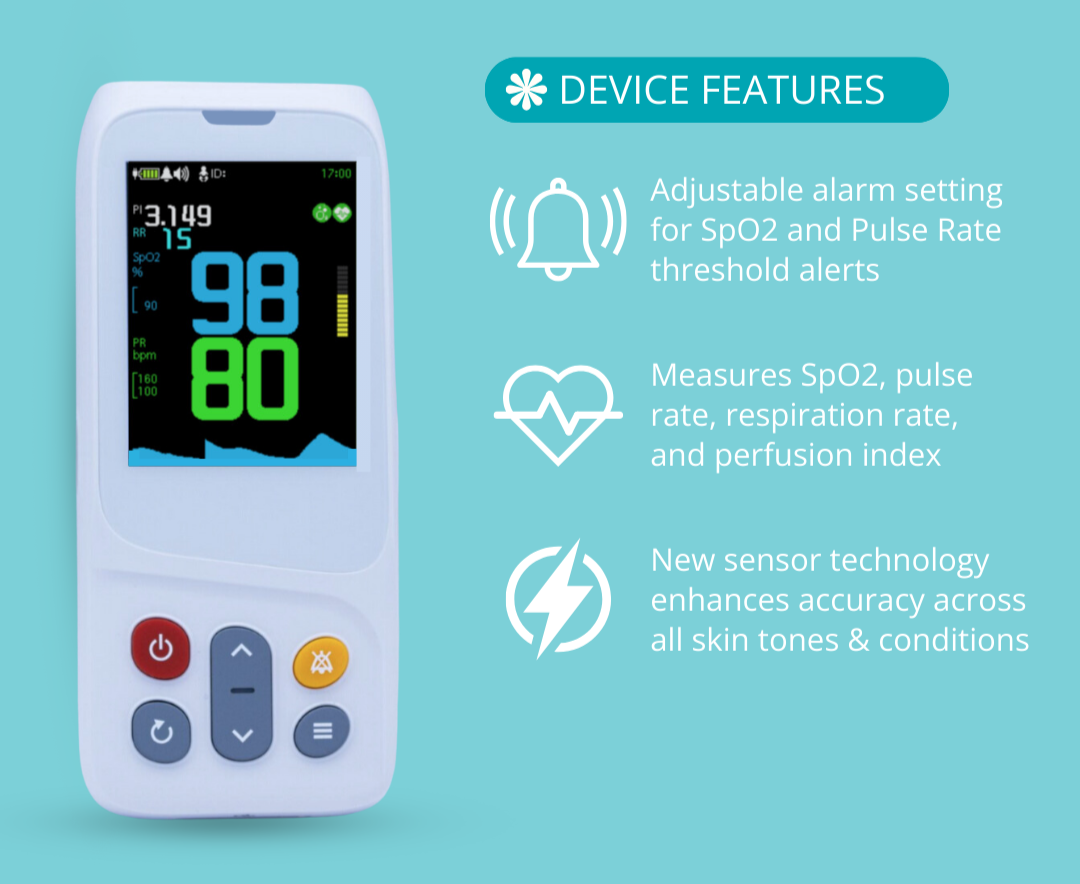
The PC-303 is a multi-parameter spot-check monitor that captures several vital measurements using a single device.
With the included sensors and accessories, it can measure:
- Blood pressure (SYS/DIA)
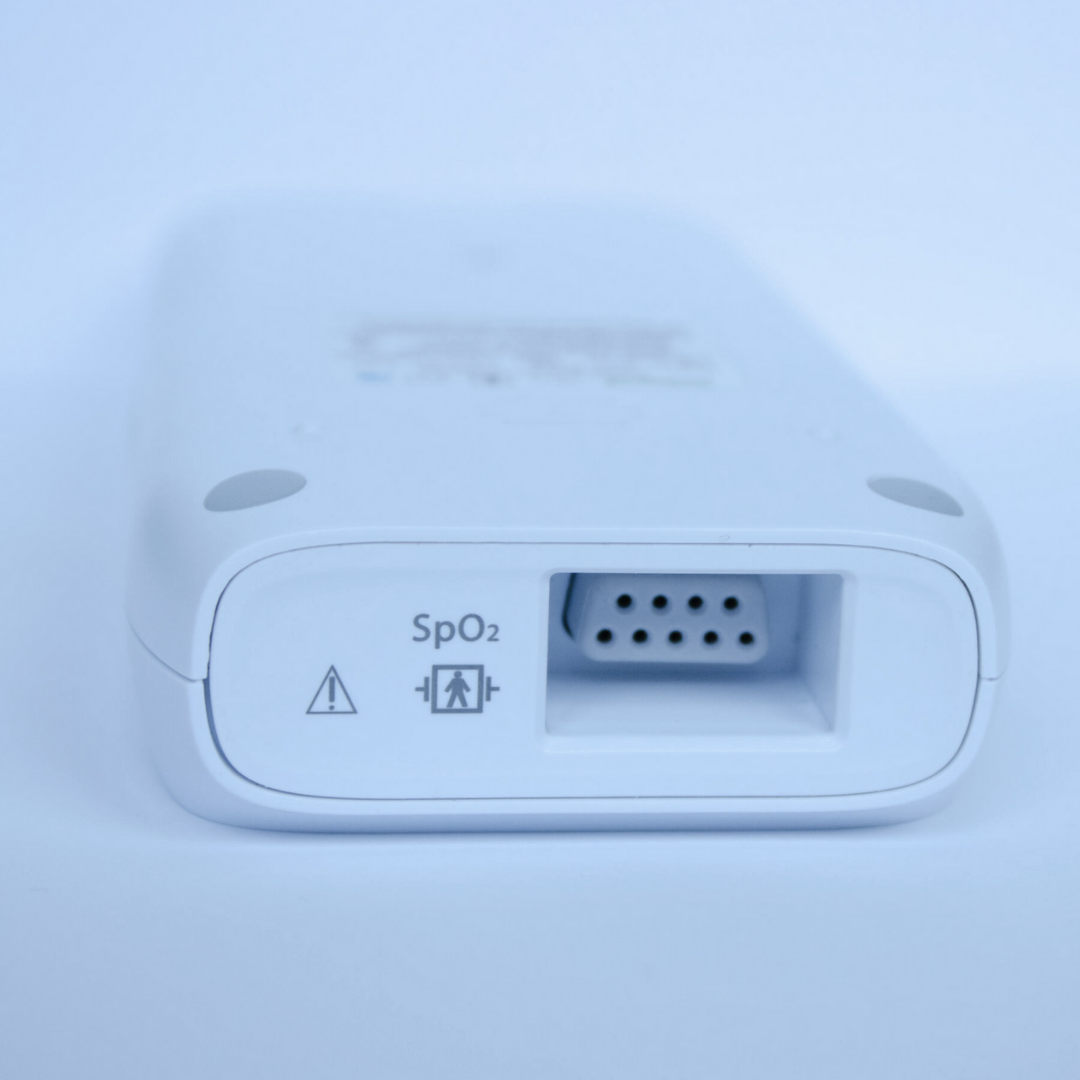
- Oxygen saturation (SpO₂)
- Pulse rate (PR)
- Body temperature
- Blood glucose (GLU)
- Electrocardiogram (ECG)
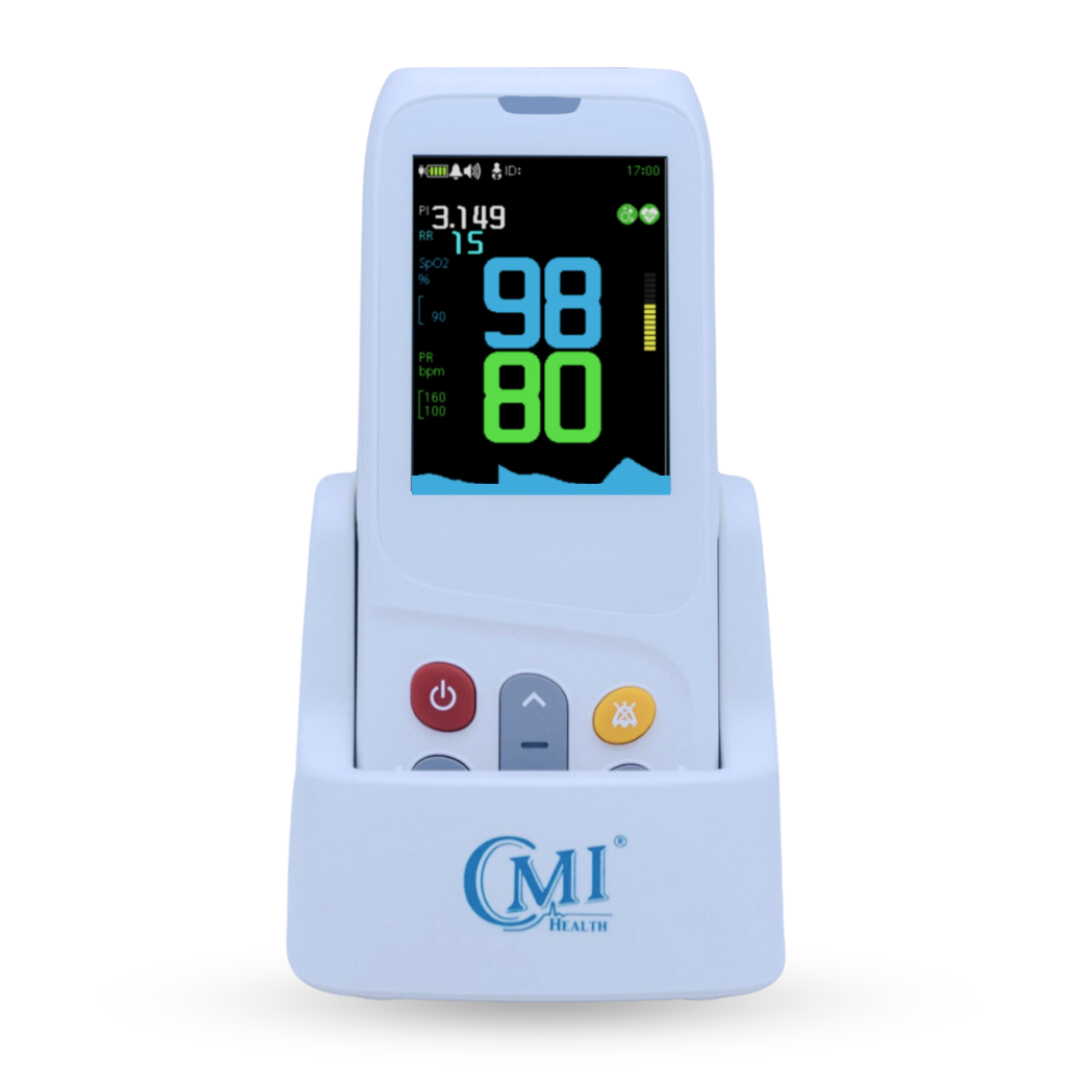
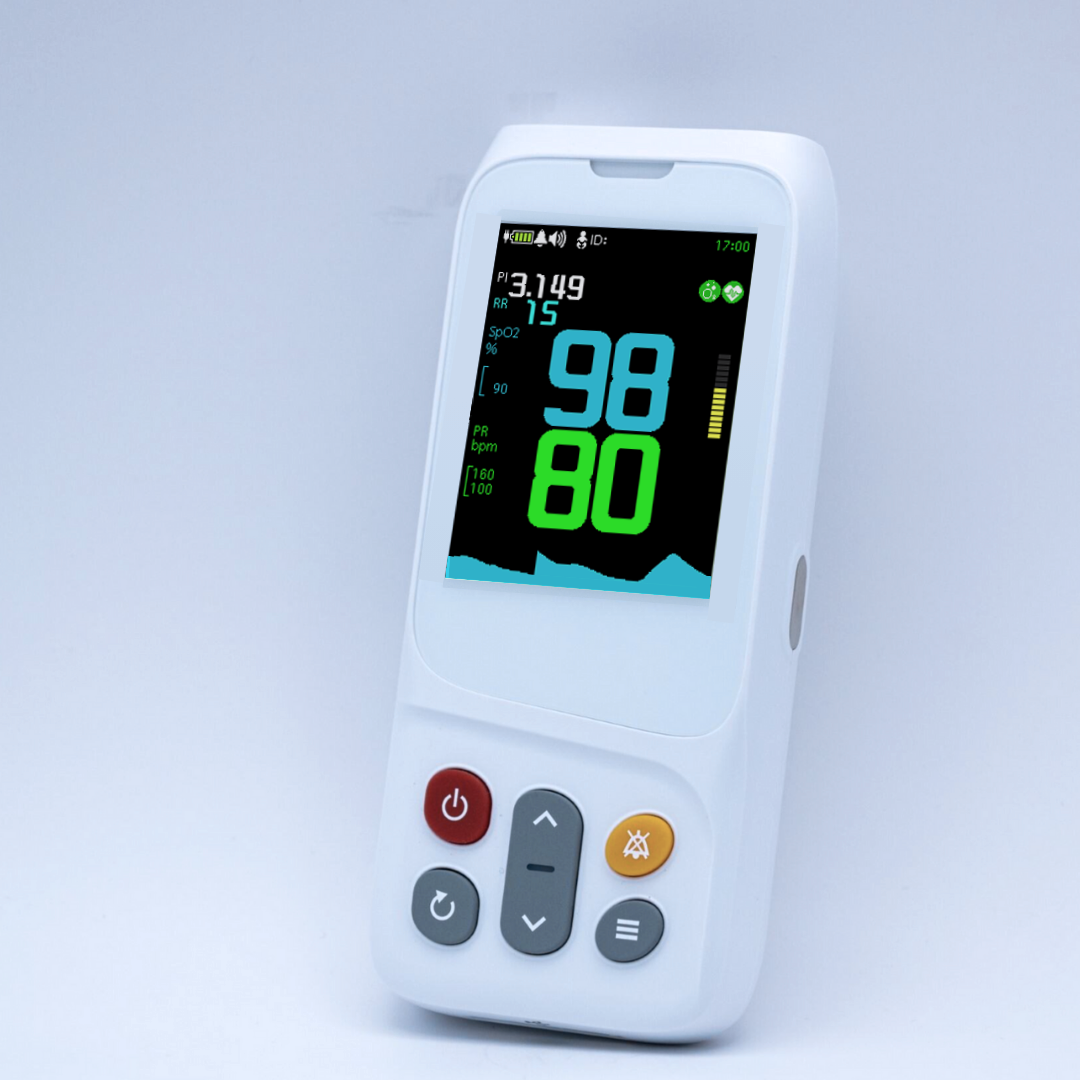
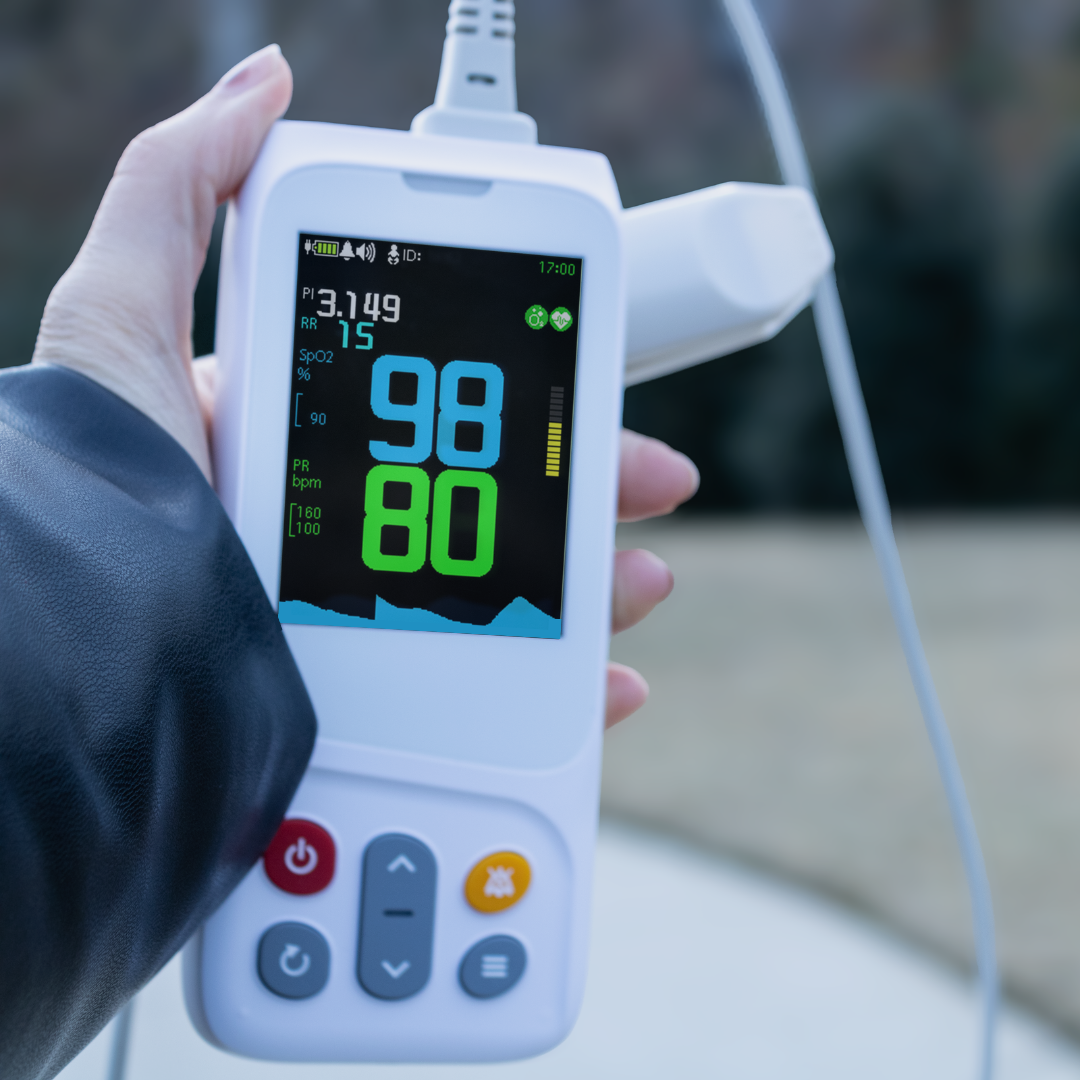
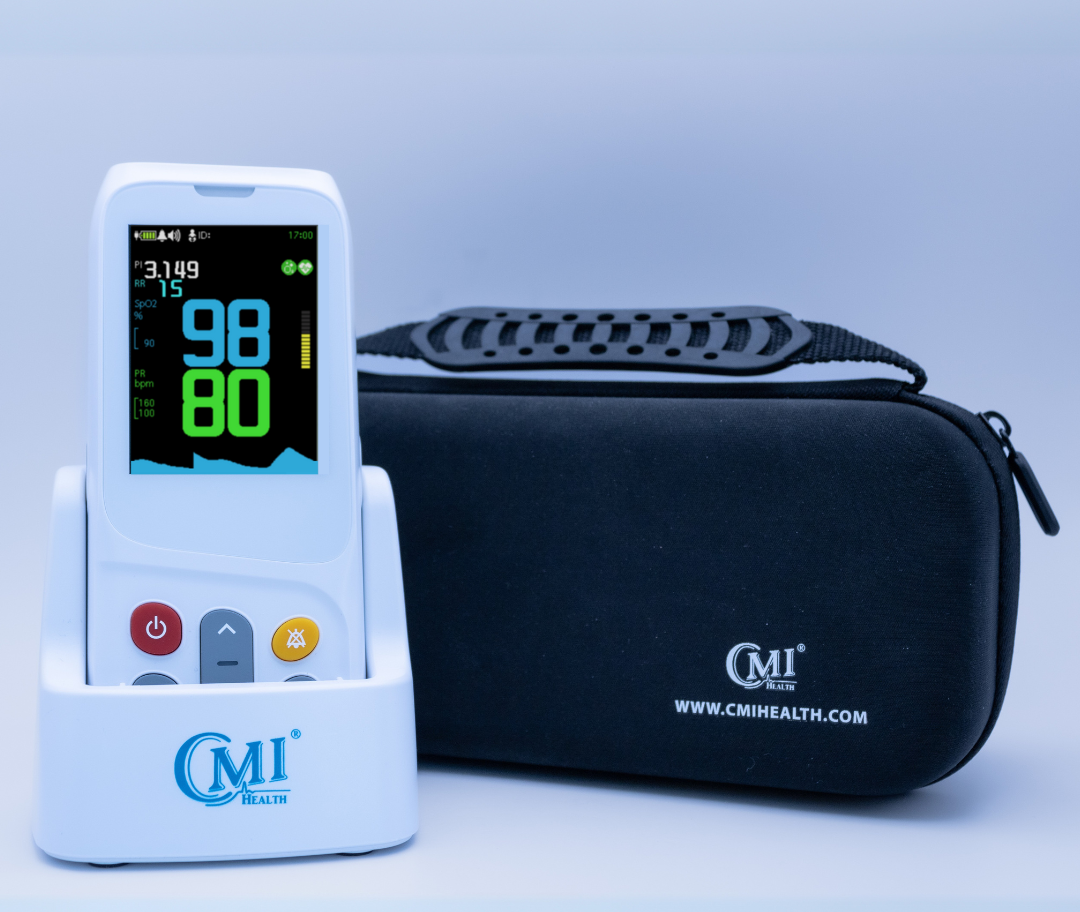
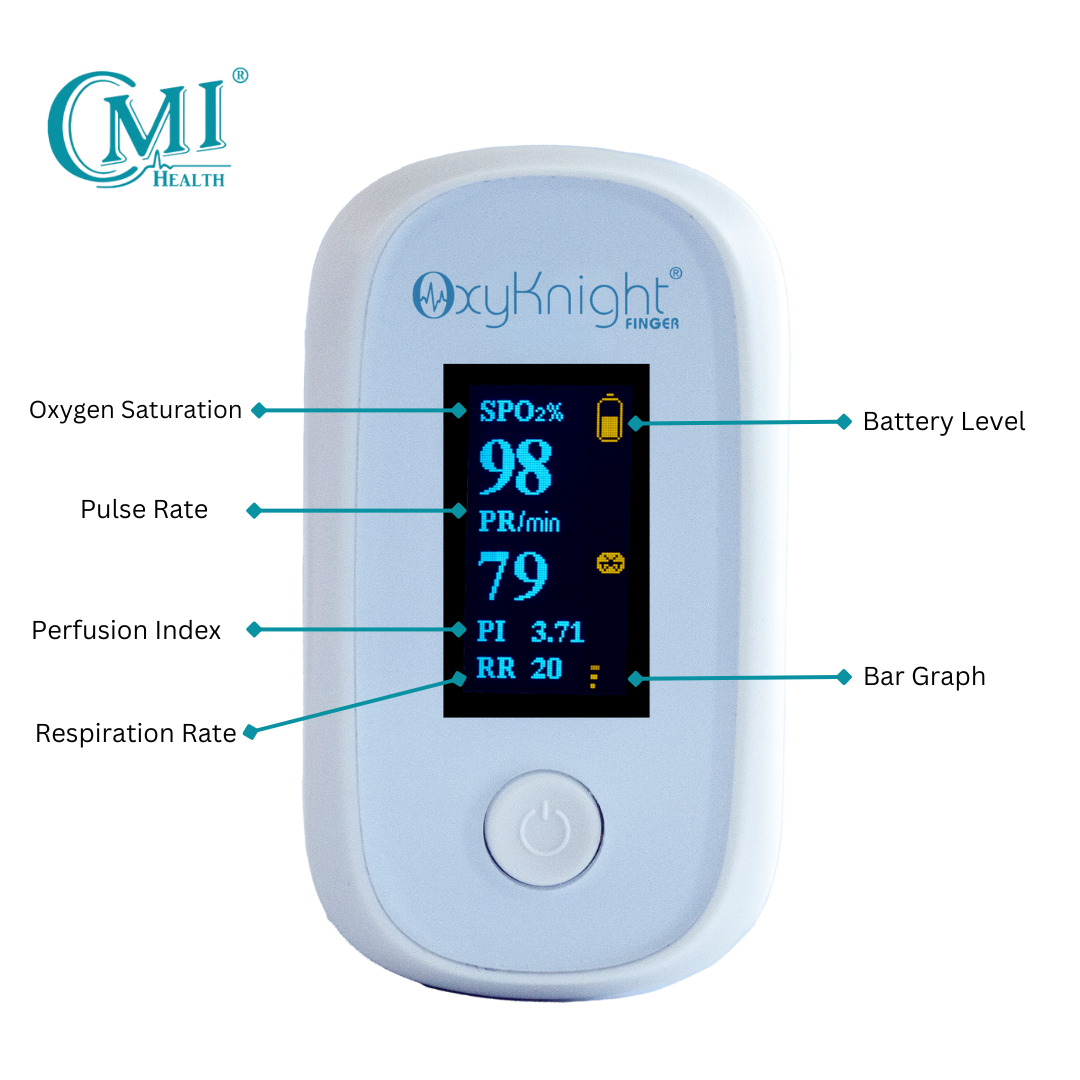
How to Read the PC-303 Vital Signs Monitor Display
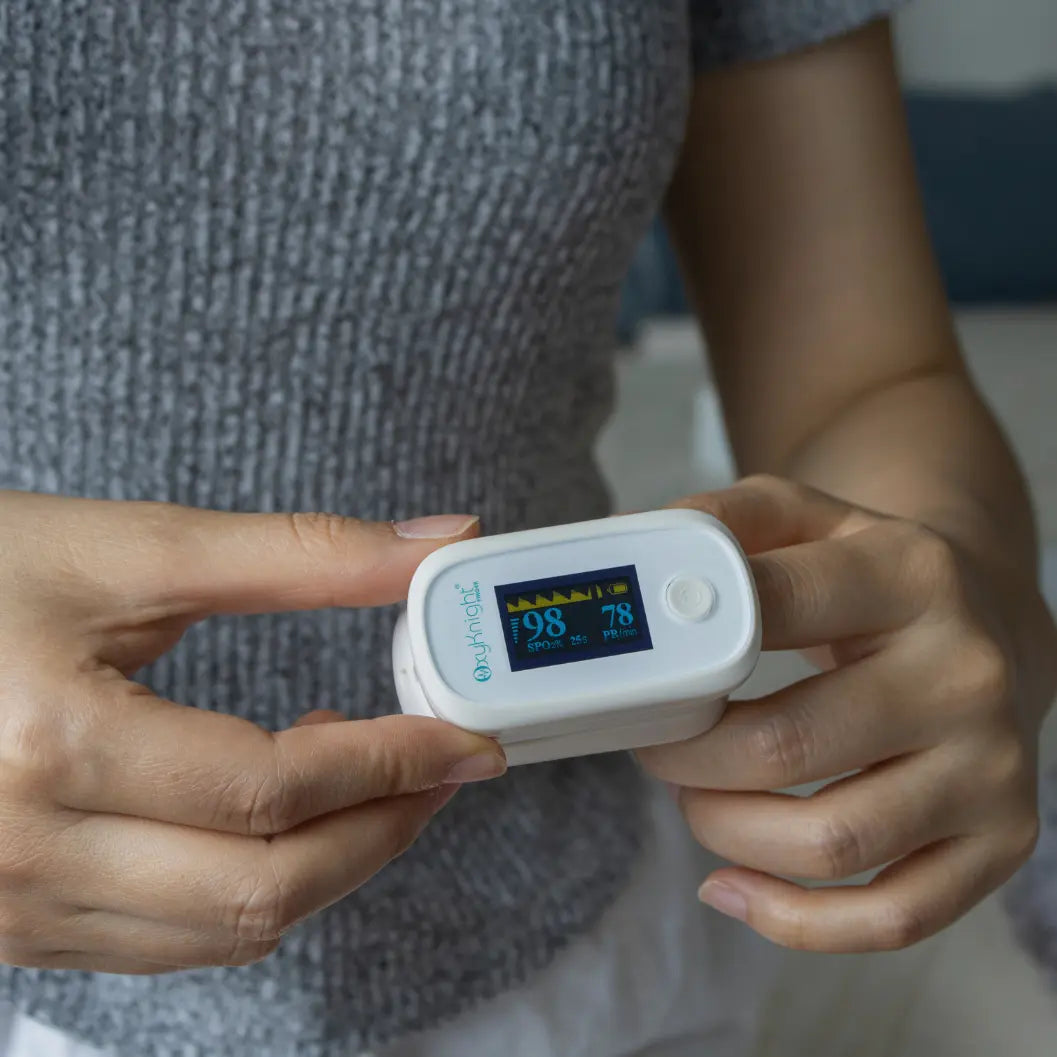
When clinicians understand how the PC-303 Vital Signs Monitor organizes information on the screen, they can quickly interpret patient measurements during spot-check assessments.

Below are the primary sections of the monitor display:
Blood Pressure (SYST/DIAS)
The upper portion of the display shows blood pressure readings, represented as:
-
SYST (Systolic pressure) - arterial pressure during ventricular contraction
-
DIAS (Diastolic pressure) - arterial pressure during ventricular relaxation
Together, these values represent arterial pressure during different phases of the cardiac cycle.
Example reading:
180 / 90 mmHg
Blood pressure measurements provide important insight into cardiovascular function and circulatory status.
In addition to displaying the numeric blood pressure reading, the PC-303 monitor includes a visual classification scale that helps clinicians quickly identify whether the measurement falls within normal or hypertensive ranges.
Blood Pressure Classification Indicator
The PC-303 Vital Signs Monitor includes a color-coded blood pressure classification indicator located on the left side of the display. This scale provides a quick visual reference for interpreting blood pressure readings.

When a blood pressure measurement is taken, the monitor highlights the corresponding category on this scale, allowing clinicians to quickly determine how the reading compares with standard blood pressure ranges.
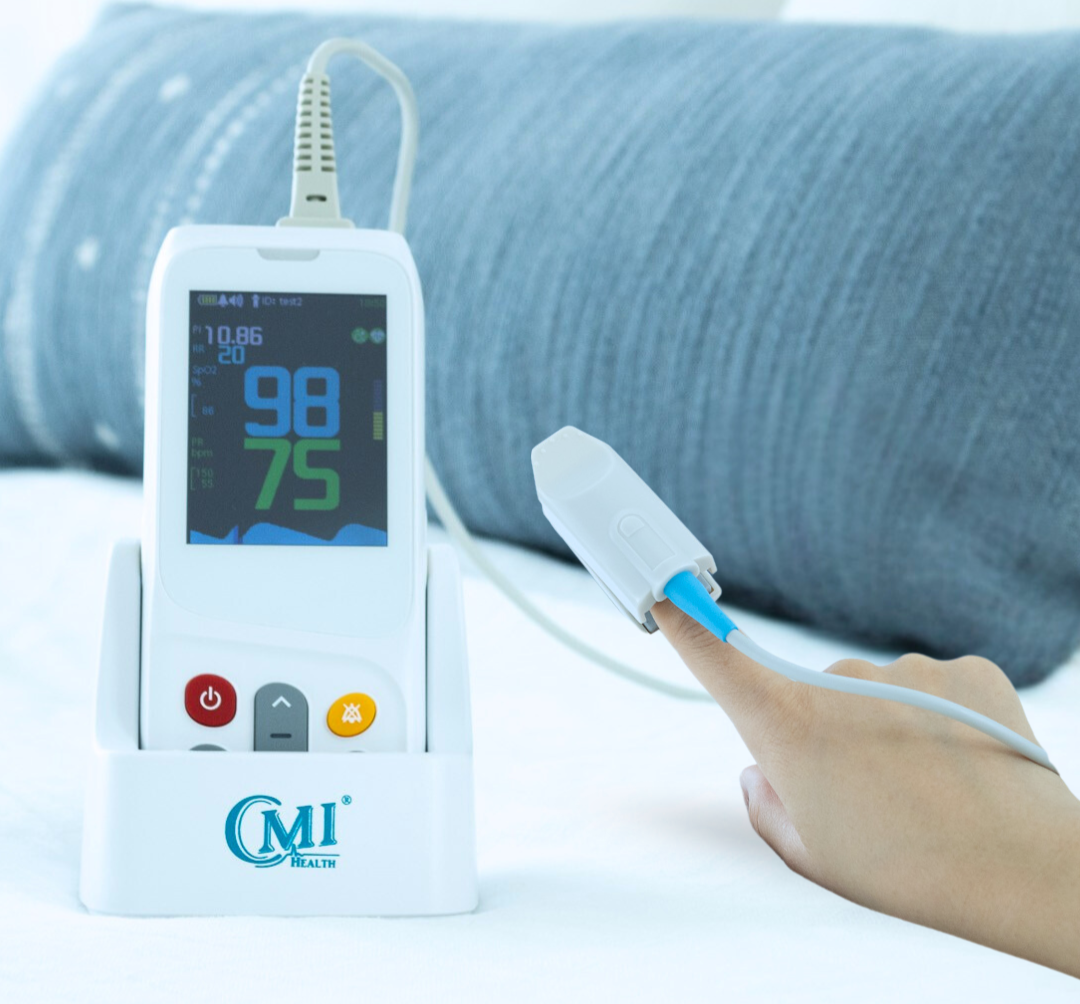
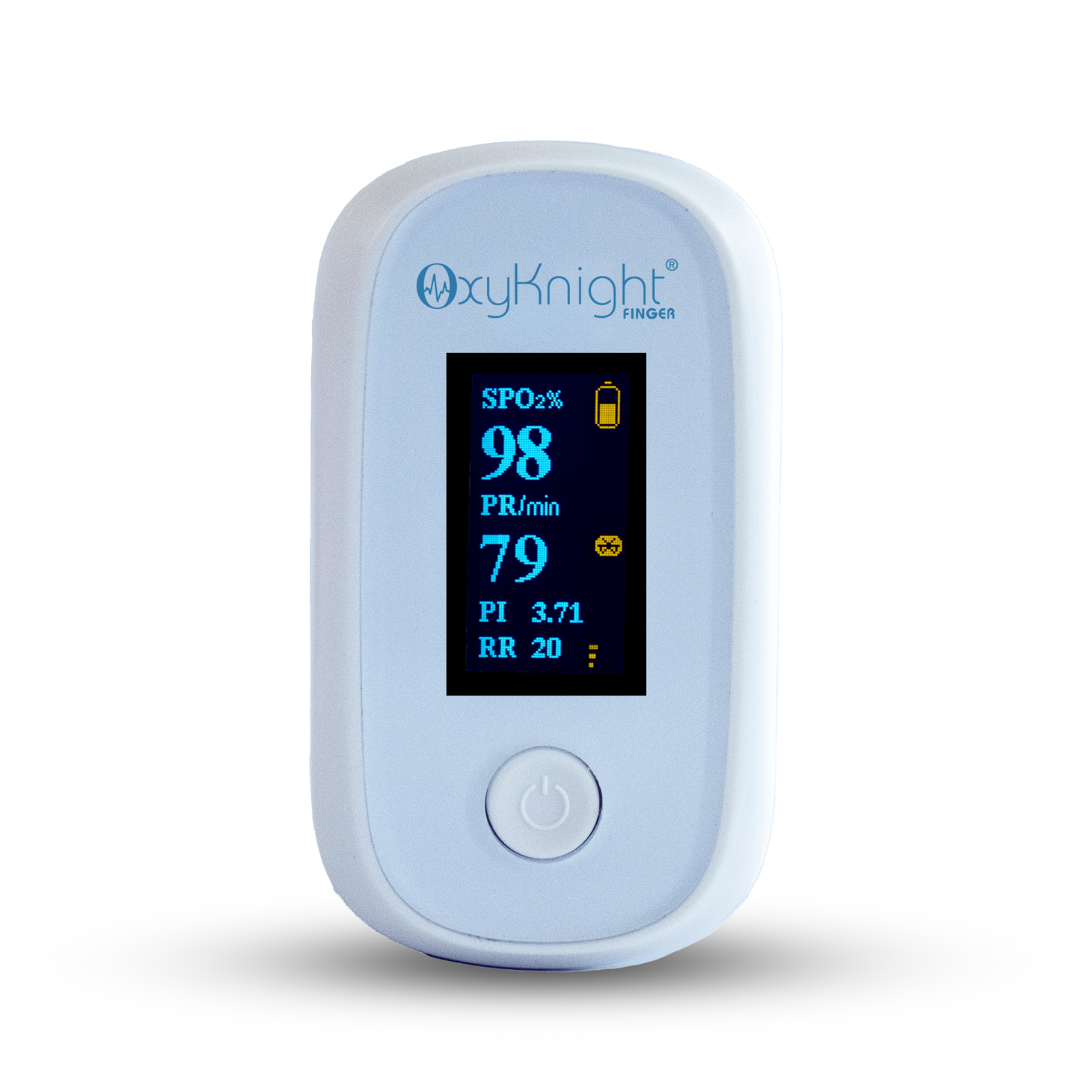
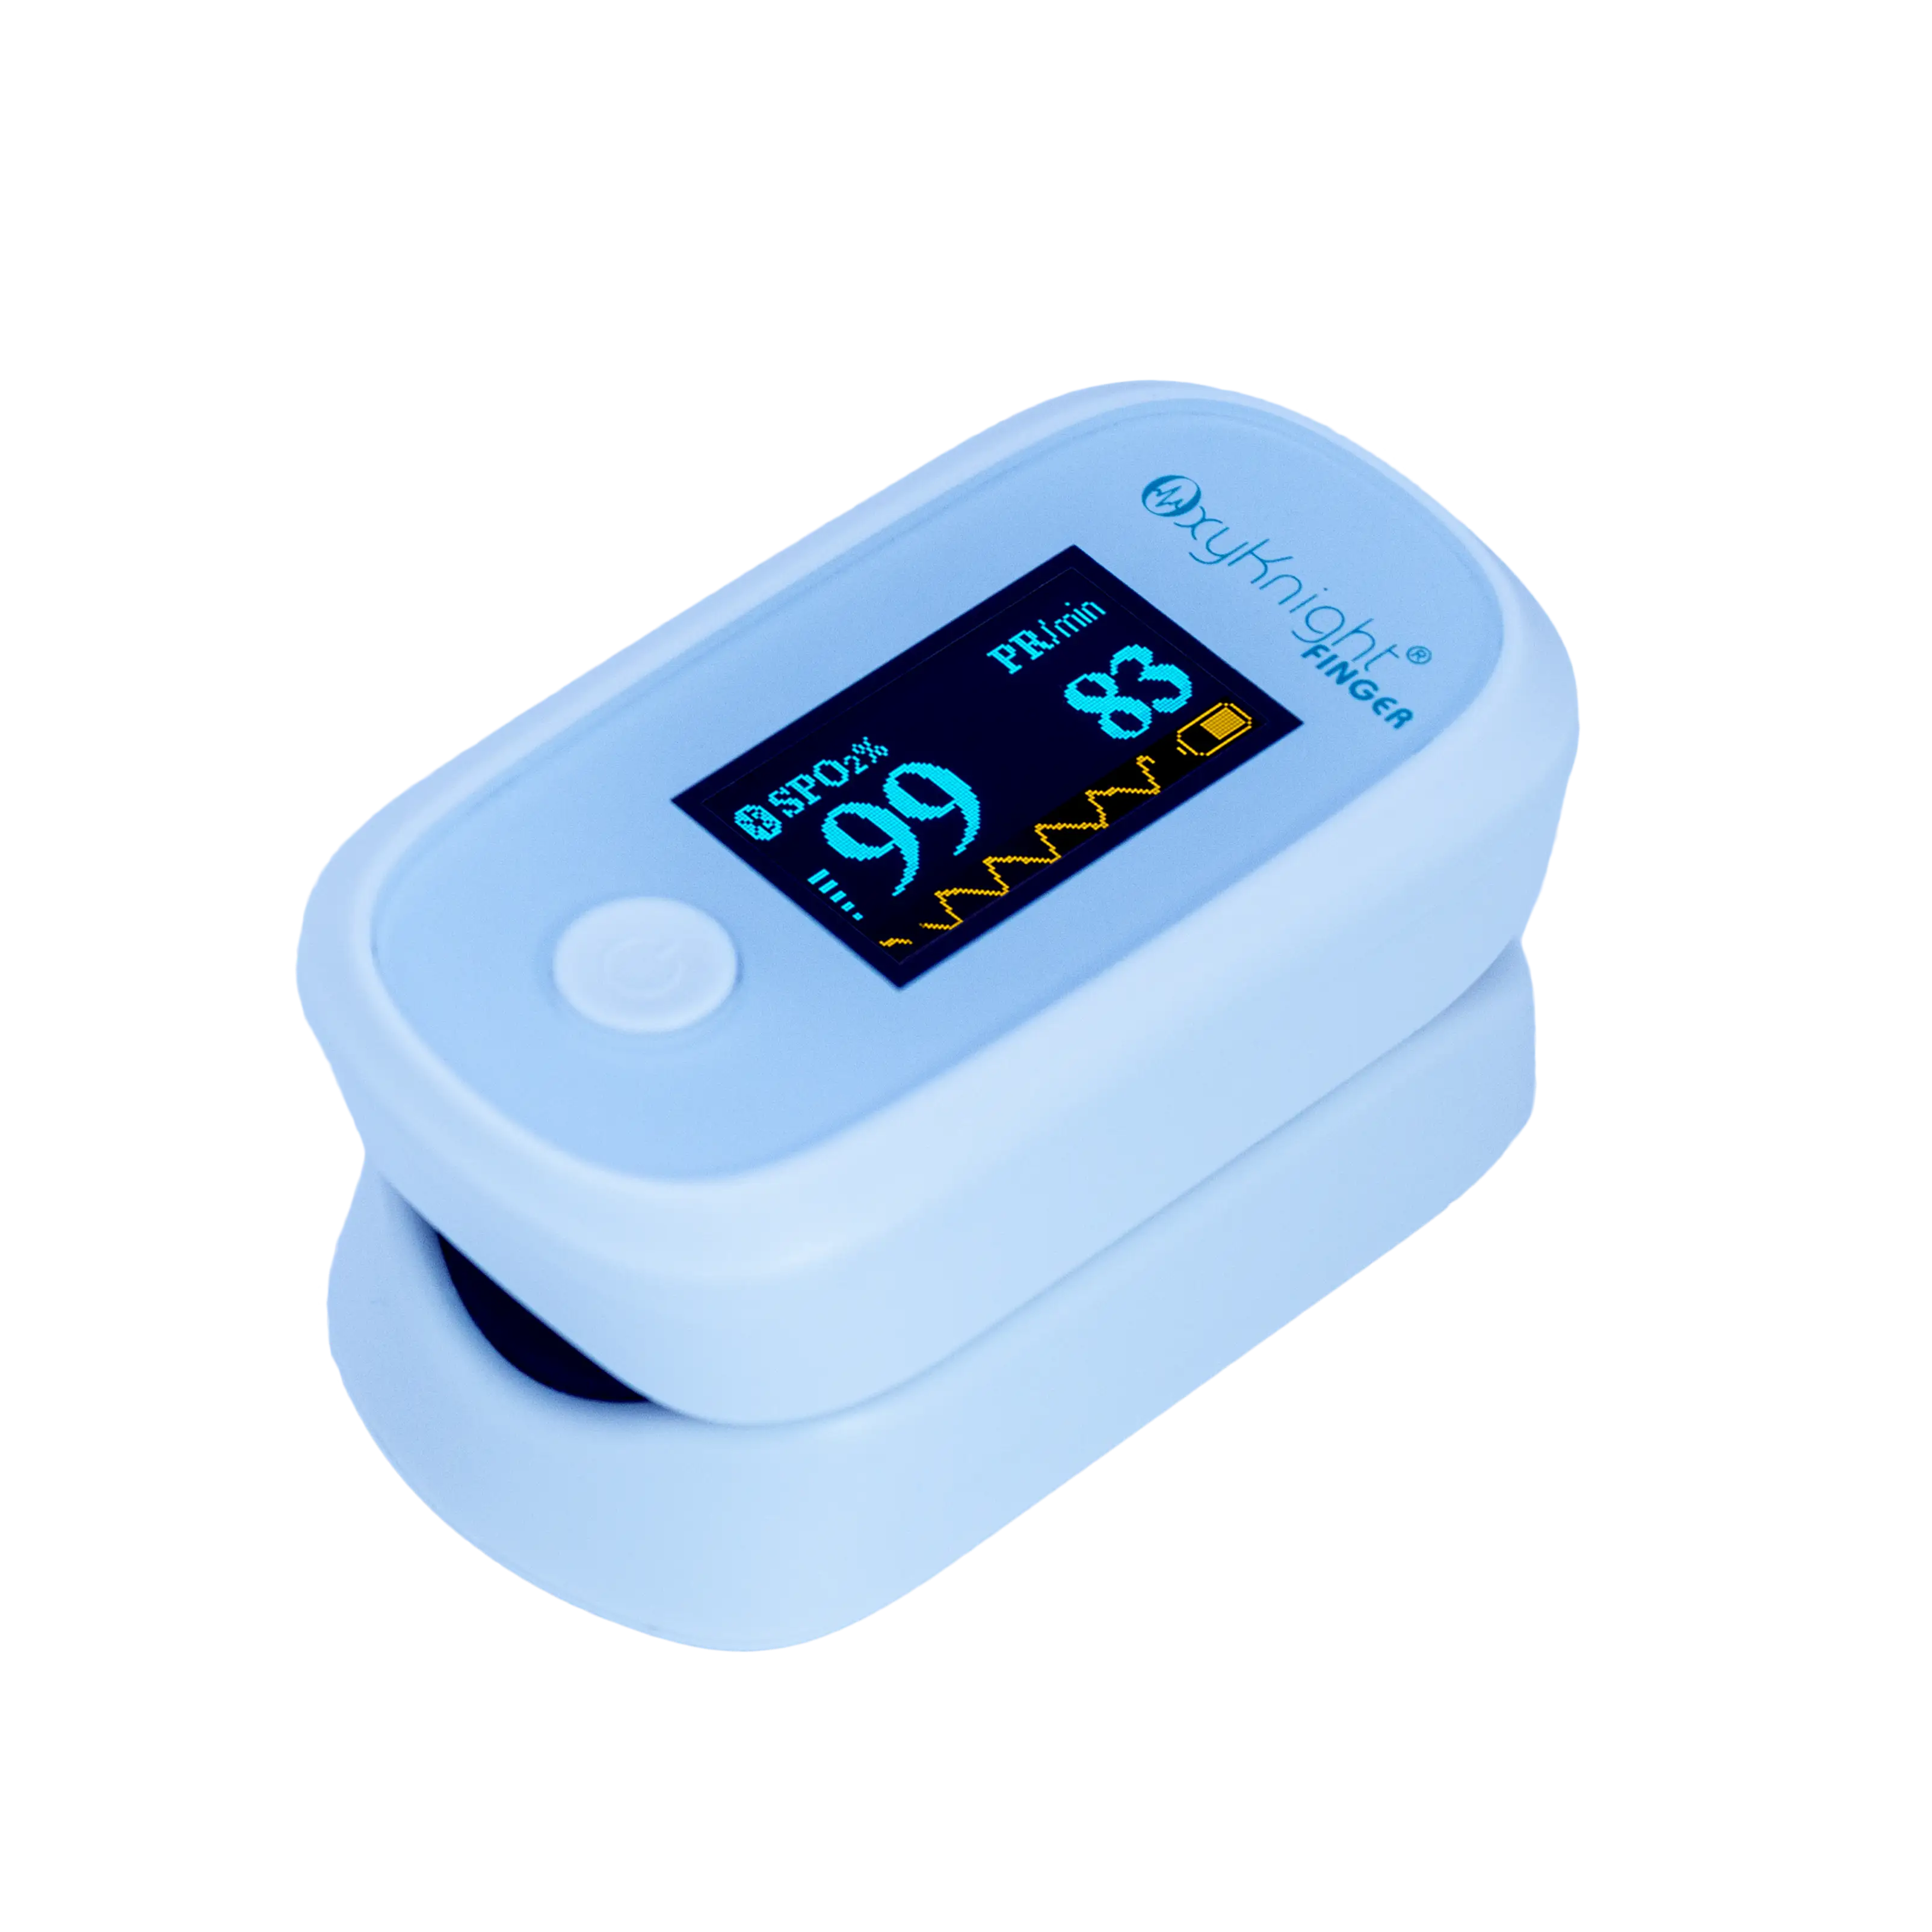
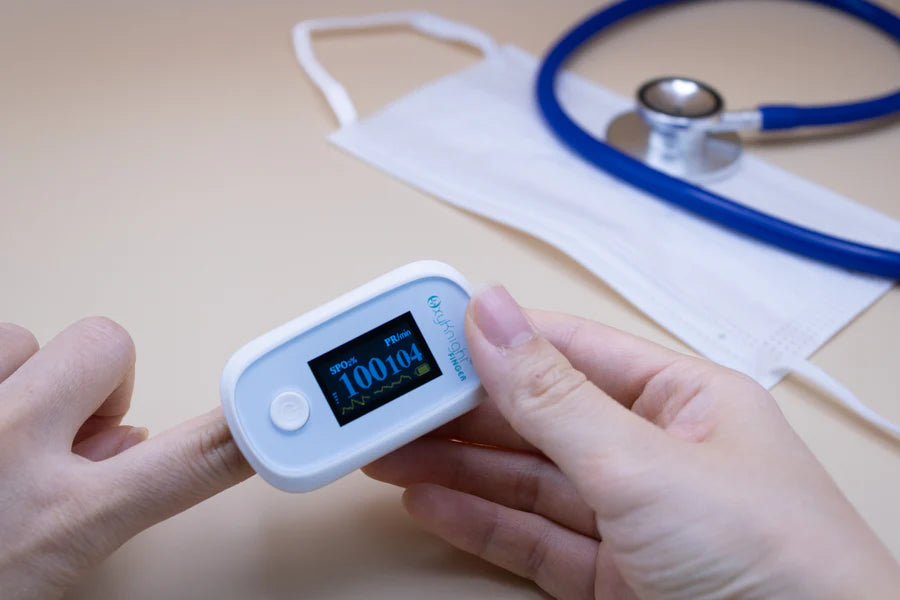
Oxygen Saturation (SpO₂)
The SpO₂ value represents the percentage of oxygen-saturated hemoglobin circulating in the bloodstream.
Typical adult oxygen saturation ranges are shown below.

Pulse Rate (PR)
The pulse rate (PR) shows the number of heart beats per minute detected by the monitor from the pulse signal.

Monitoring pulse rate trends can help clinicians evaluate cardiovascular response to treatment, stress, or physical activity.
Temperature / Glucose Field
The lower portion of the display shows either body temperature or blood glucose readings, depending on the measurement mode.
Temperature may be displayed in °C or °F, while glucose readings are typically displayed in mg/dL or mmol/L, depending on device configuration.
Measurement Memory & Timestamp
The lower-left area of the screen displays stored measurement information, including:
-
Patient ID
-
Measurement number
-
Time recorded (H:M)
-
Date recorded (M-D)
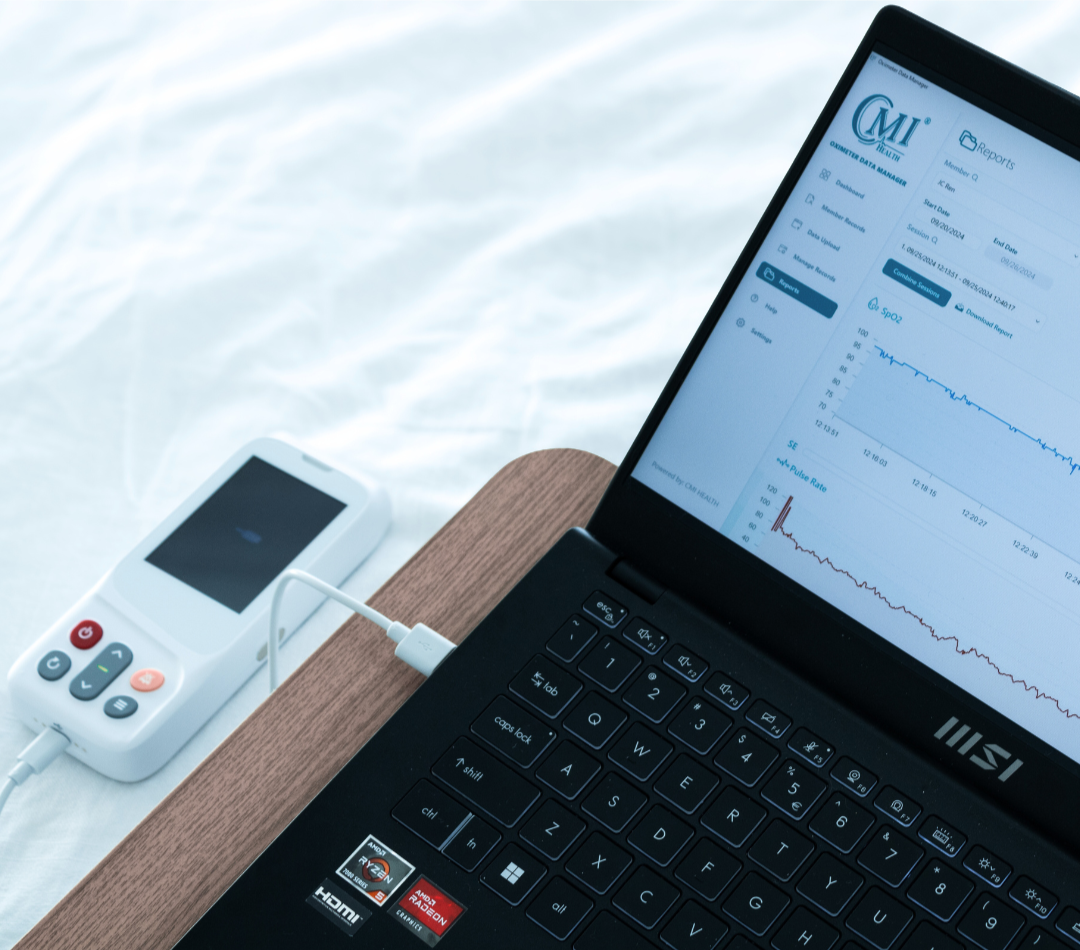
This allows clinicians to review previously recorded measurements directly on the device.
ECG Capability on the PC-303 Monitor
Although the ECG measurement is not currently displayed on the monitor screen shown above, the PC-303 Vital Signs Monitor supports basic ECG monitoring as part of its multi-parameter capabilities.
The device includes the accessories required to capture ECG signals during patient assessments.

These options allow clinicians to record cardiac electrical activity when ECG monitoring is required during a patient evaluation.
Why Understanding Monitor Displays Matters
Understanding how each parameter appears on the monitor allows healthcare professionals to:
-
Identify abnormal vital signs
-
Recognize trends in patient status
-
Verify measurement accuracy
-
Make informed clinical decisions
Devices such as the PC-303 Vital Signs Monitor present multiple vital sign measurements in a clear, organized interface, allowing clinicians to quickly interpret patient data during routine monitoring, triage, and bedside evaluations.
Explore the PC-303 Vital Signs Monitor to learn more about its features and clinical applications.


Leave a comment